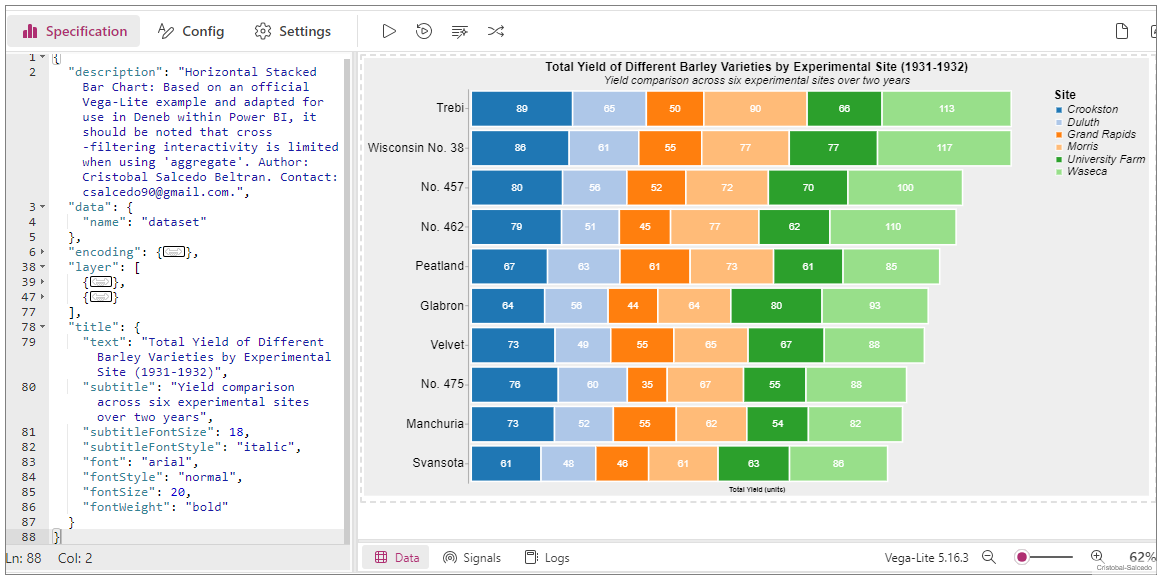
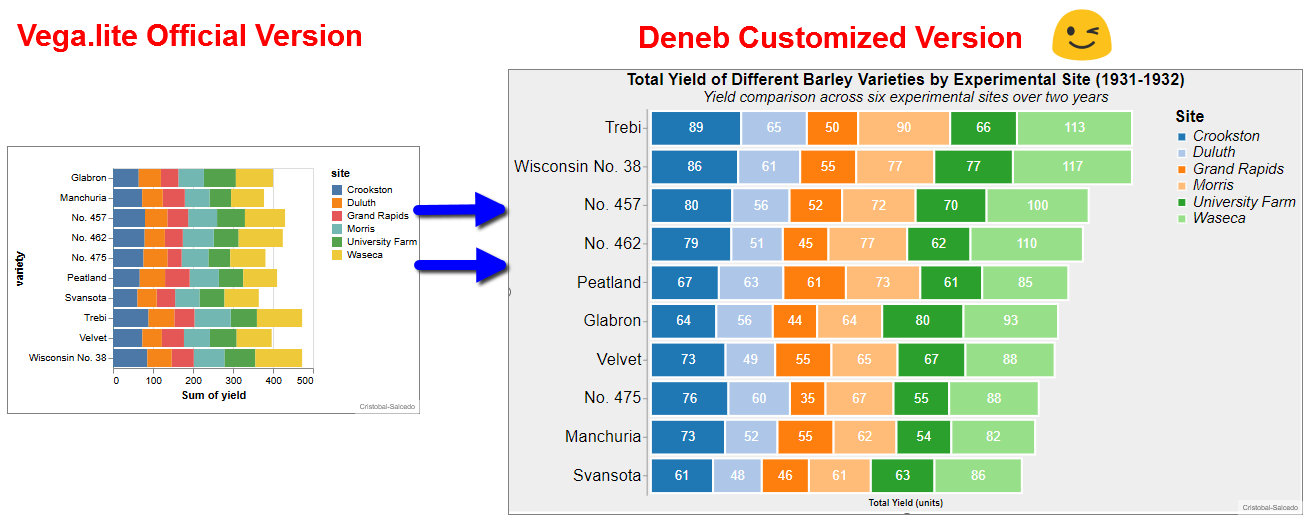
Horizontal Stacked Bar Chart Template
This horizontal stacked bar chart template is adapted from the official Vega-Lite example and customized for Deneb in Power BI. Enhancements include the addition of labels, a descriptive title, and sorted data for better clarity. Please note that cross-filtering interactivity is not possible due to the use of the ‘aggregate’ function.
Configuration Details
The image shows how the chart is configured in Deneb and Power BI, highlighting the following key properties:
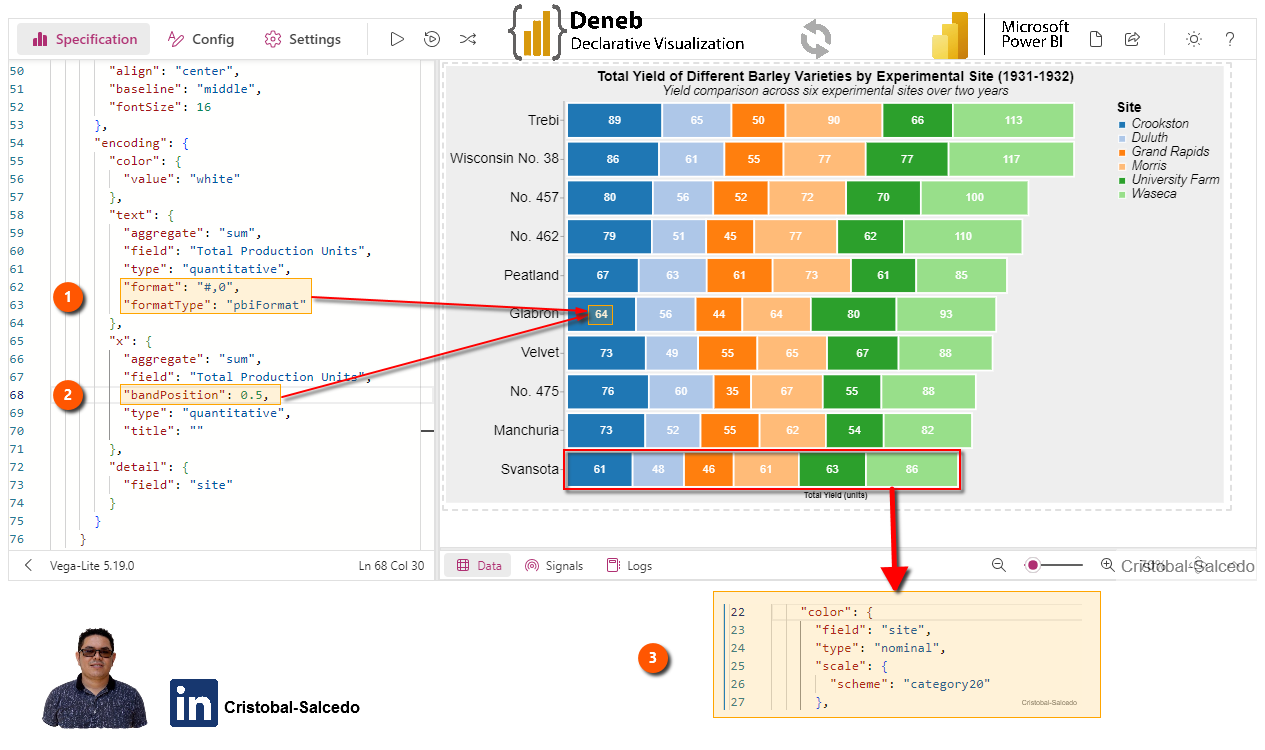
1. Text Format Configuration
The format "#,0" displays numbers without decimals. For Power BI, "formatType": "pbiFormat" is used, configured in Deneb. More information at: Deneb Viz Formatting.
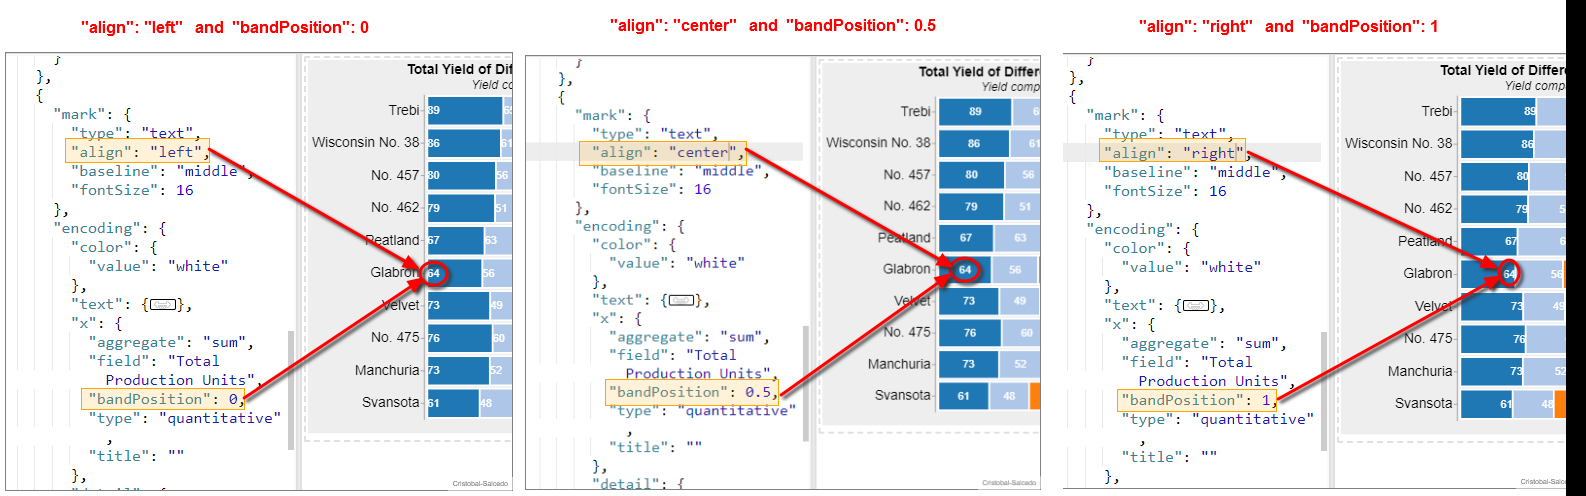
2. bandPosition Property: 0.5
Adjusts the position of the bands in the chart, centering the text within each category to improve visual alignment. In this specific case, it is used to center the text. This property handles three values: 0 to position at the beginning, 0.5 to center, and 1 to place at the end.
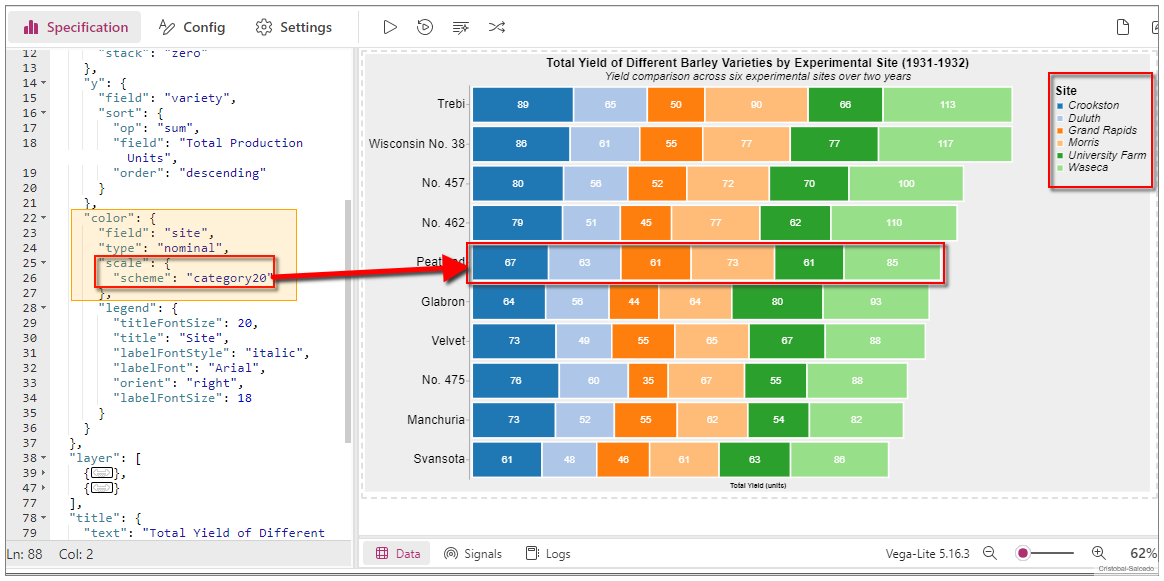
3. Color Configuration
Based on the "site" field, it uses the "category20" color scale to visually differentiate the experimental sites. This scheme is specific to VEGA. More information at: VEGA Schemes.
Result
Download the files used here
🔽 Horizontal_Stacked_Bar_Chart.pbix (4.33 MB)
🔽 Template_Stacked_Bar_Chart_Horizontal.json: (3.93 KB)
References
- Vega-Lite Horizontal Stacked Bar Chart Example: This example illustrates a Horizontal Stacked Bar Chart using Vega-Lite, serving as a foundational guide for creating complex visualizations.
- Advanced Options for the pbiFormat Function: A detailed guide on using the pbiFormat function for advanced formatting options.
- Formatting in Deneb: A comprehensive resource on formatting techniques in Deneb.
- Schemes in Deneb: This resource offers insights into the various schemes available in Deneb, helping to customize and enhance the visual appeal of your charts.
- Categorical Schemes: Information on categorical schemes in Vega, useful for categorization and visual differentiation in charts.
Copy the Template Below👇✔
 {
  "$schema": "https://vega.github.io/schema/vega-lite/v5.json",
  "usermeta": {
    "deneb": {
      "build": "1.6.2.1",
      "metaVersion": 1,
      "provider": "vegaLite",
      "providerVersion": "5.16.3"
    },
    "interactivity": {
      "tooltip": true,
      "contextMenu": true,
      "selection": false,
      "highlight": false,
      "dataPointLimit": 50
    },
    "information": {
      "name": "Horizontal Stacked Bar Chart",
      "description": "Horizontal Stacked Bar Chart: Based on an official Vega-Lite example and adapted for use in Deneb within Power BI, it should be noted that cross-filtering interactivity is limited when using 'aggregate'. Author: Cristobal Salcedo Beltran. Contact: csalcedo90@gmail.com",
      "author": "Cristobal Salcedo Beltran",
      "uuid": "290227de-ebef-42ff-977d-6015324bb0fd",
      "generated": "2024-07-24T04:59:06.947Z"
    },
    "dataset": [
      {
        "key": "__0__",
        "name": "Category",
        "description": "Represents the type or variety of the item. Example: \"Barley Variety\".",
        "type": "text",
        "kind": "column"
      },
      {
        "key": "__1__",
        "name": "Detail Category",
        "description": "Provides more specific details or sub-categories related to the main category. Example: \"Experimental Site\"",
        "type": "text",
        "kind": "column"
      },
      {
        "key": "__2__",
        "name": "Measure",
        "description": "Represents the quantitative measurement related to the categories. Example: \"Total Production Units",
        "type": "numeric",
        "kind": "measure"
      }
    ]
  },
  "config": {
    "view": {"stroke": "transparent"},
    "background": "#eee",
    "axisX": {
      "labels": false,
      "ticks": false,
      "domain": false,
      "grid": false,
      "title": ""
    },
    "axisY": {
      "labelFont": "arial",
      "offset": 5,
      "labelFontSize": 20,
      "title": ""
    }
  },
  "description": "Horizontal Stacked Bar Chart: Based on an official Vega-Lite example and adapted for use in Deneb within Power BI, it should be noted that cross-filtering interactivity is limited when using 'aggregate'. Author: Cristobal Salcedo Beltran. Contact: csalcedo90@gmail.com.",
  "data": {"name": "dataset"},
  "encoding": {
    "x": {
      "aggregate": "sum",
      "field": "__2__",
      "type": "quantitative",
      "title": "Total Yield (units)",
      "stack": "zero"
    },
    "y": {
      "field": "__0__",
      "sort": {
        "op": "sum",
        "field": "__2__",
        "order": "descending"
      }
    },
    "color": {
      "field": "__1__",
      "type": "nominal",
      "scale": {"scheme": "category20"},
      "legend": {
        "titleFontSize": 20,
        "title": "Site",
        "labelFontStyle": "italic",
        "labelFont": "Arial",
        "orient": "right",
        "labelFontSize": 18
      }
    }
  },
  "layer": [
    {
      "mark": {
        "type": "bar",
        "opacity": 1,
        "stroke": "white",
        "strokeWidth": 2.5
      }
    },
    {
      "mark": {
        "type": "text",
        "align": "center",
        "baseline": "middle",
        "fontSize": 16
      },
      "encoding": {
        "color": {"value": "white"},
        "text": {
          "aggregate": "sum",
          "field": "__2__",
          "type": "quantitative",
          "format": "#,0",
          "formatType": "pbiFormat"
        },
        "x": {
          "aggregate": "sum",
          "field": "__2__",
          "bandPosition": 0.5,
          "type": "quantitative",
          "title": ""
        },
        "detail": {"field": "__1__"}
      }
    }
  ],
  "title": {
    "text": "Total Yield of Different Barley Varieties by Experimental Site (1931-1932)",
    "subtitle": "Yield comparison across six experimental sites over two years",
    "subtitleFontSize": 18,
    "subtitleFontStyle": "italic",
    "font": "arial",
    "fontStyle": "normal",
    "fontSize": 20,
    "fontWeight": "bold"
  }
}