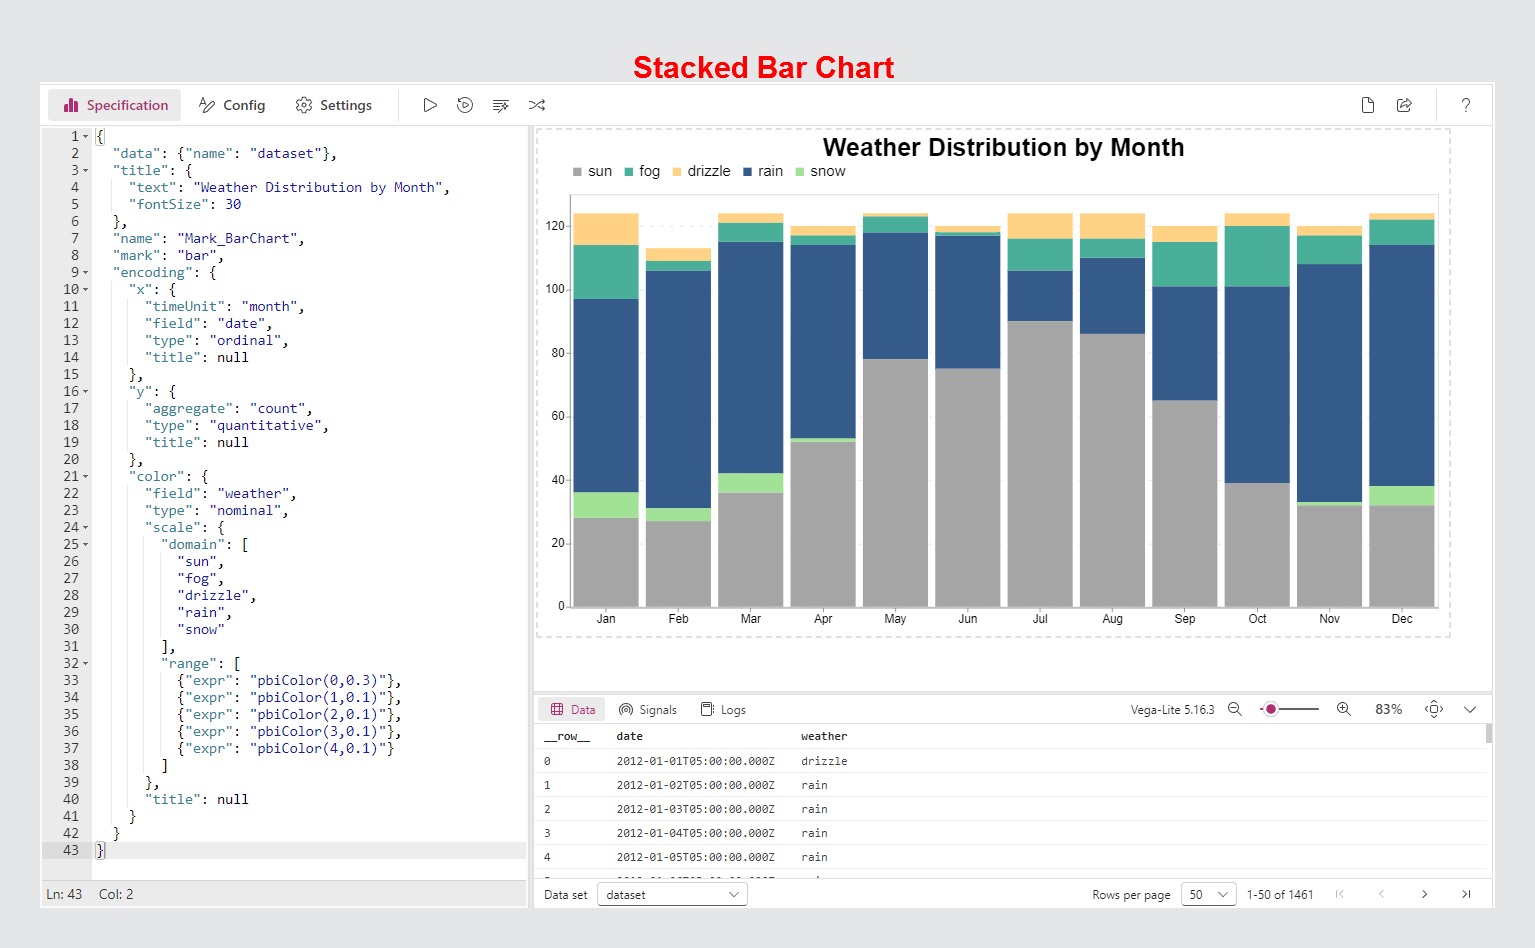
Stacked Bar Chart Template
This Stacked Bar Chart template, adapted from the official Vega-Lite example and has been adapted for Deneb in Power BI. Note that cross-filtering interactivity is not possible due to the use of the ‘aggregate’ function.
Download the files used here
🔽 Stacked_Bar_Chart.pbix (2.03 MB)
🔽 Template_Stacked_Bar_Chart.json: (2.58 KB)
References
- Vega-Lite Stacked Bar Chart Example: This example illustrates a Stacked Bar Chart using Vega-Lite, serving as a foundational guide for creating complex visualizations.
- Advanced Options for pbiFormat Function: A detailed guide on using the pbiFormat function for advanced formatting options.
- Deneb Formatting: A comprehensive resource on formatting techniques in Deneb.
- Deneb Schemes: This resource offers insights into various schemes available in Deneb, helping to customize and enhance the visual appeal of your charts.
Copy Template👇✔
 {
  "$schema": "https://vega.github.io/schema/vega-lite/v5.json",
  "usermeta": {
    "deneb": {
      "build": "1.6.2.1",
      "metaVersion": 1,
      "provider": "vegaLite",
      "providerVersion": "5.16.3"
    },
    "interactivity": {
      "tooltip": true,
      "contextMenu": true,
      "selection": false,
      "highlight": false,
      "dataPointLimit": 50
    },
    "information": {
      "name": "Stacked Bar Chart",
      "description": "Based on an official Vega-Lite example and adapted for use in Deneb within Power BI, it should be noted that cross-filtering interactivity is limited when using 'aggregate'. Author: Cristobal Salcedo Beltran. Contact: csalcedo90@gmail.com.",
      "author": "Cristobal Salcedo Beltran",
      "uuid": "68fcd6b9-6d3f-45a9-b0db-88f453cbc2df",
      "generated": "2024-07-11T02:41:35.472Z"
    },
    "dataset": [
      {
        "key": "__0__",
        "name": "Date",
        "description": "",
        "type": "dateTime",
        "kind": "column"
      },
      {
        "key": "__1__",
        "name": "Category",
        "description": "",
        "type": "text",
        "kind": "column"
      }
    ]
  },
  "config": {
    "axisY": {
      "labelFontSize": 14,
      "tickCount": 6,
      "gridDash": [4, 8]
    },
    "axisX": {
      "labelFontSize": 14,
      "offset": 1,
      "labelExpr": "[pbiFormat(datum.value,'MMM'),month(datum.value)===0? pbiFormat(datum.value,'yyyy'):'']"
    },
    "legend": {
      "orient": "top",
      "labelFontSize": 18
    }
  },
  "description": "Based on an official Vega-Lite example and adapted for use in Deneb within Power BI, it should be noted that cross-filtering interactivity is limited when using 'aggregate'. Author: Cristobal Salcedo Beltran. Contact: csalcedo90@gmail.com.",
  "data": {"name": "dataset"},
  "title": {
    "text": "Weather Distribution by Month",
    "fontSize": 30
  },
  "name": "Mark_BarChart",
  "mark": "bar",
  "encoding": {
    "x": {
      "timeUnit": "month",
      "field": "__0__",
      "type": "ordinal",
      "title": null
    },
    "y": {
      "aggregate": "count",
      "type": "quantitative",
      "title": null
    },
    "color": {
      "field": "__1__",
      "type": "nominal",
      "scale": {
        "domain": [
          "sun",
          "fog",
          "drizzle",
          "rain",
          "snow"
        ],
        "range": [
          {"expr": "pbiColor(0,0.3)"},
          {"expr": "pbiColor(1,0.1)"},
          {"expr": "pbiColor(2,0.1)"},
          {"expr": "pbiColor(3,0.1)"},
          {"expr": "pbiColor(4,0.1)"}
        ]
      },
      "title": null
    }
  }
}
Esta entrada está licenciada bajo CC BY 4.0 por el autor.