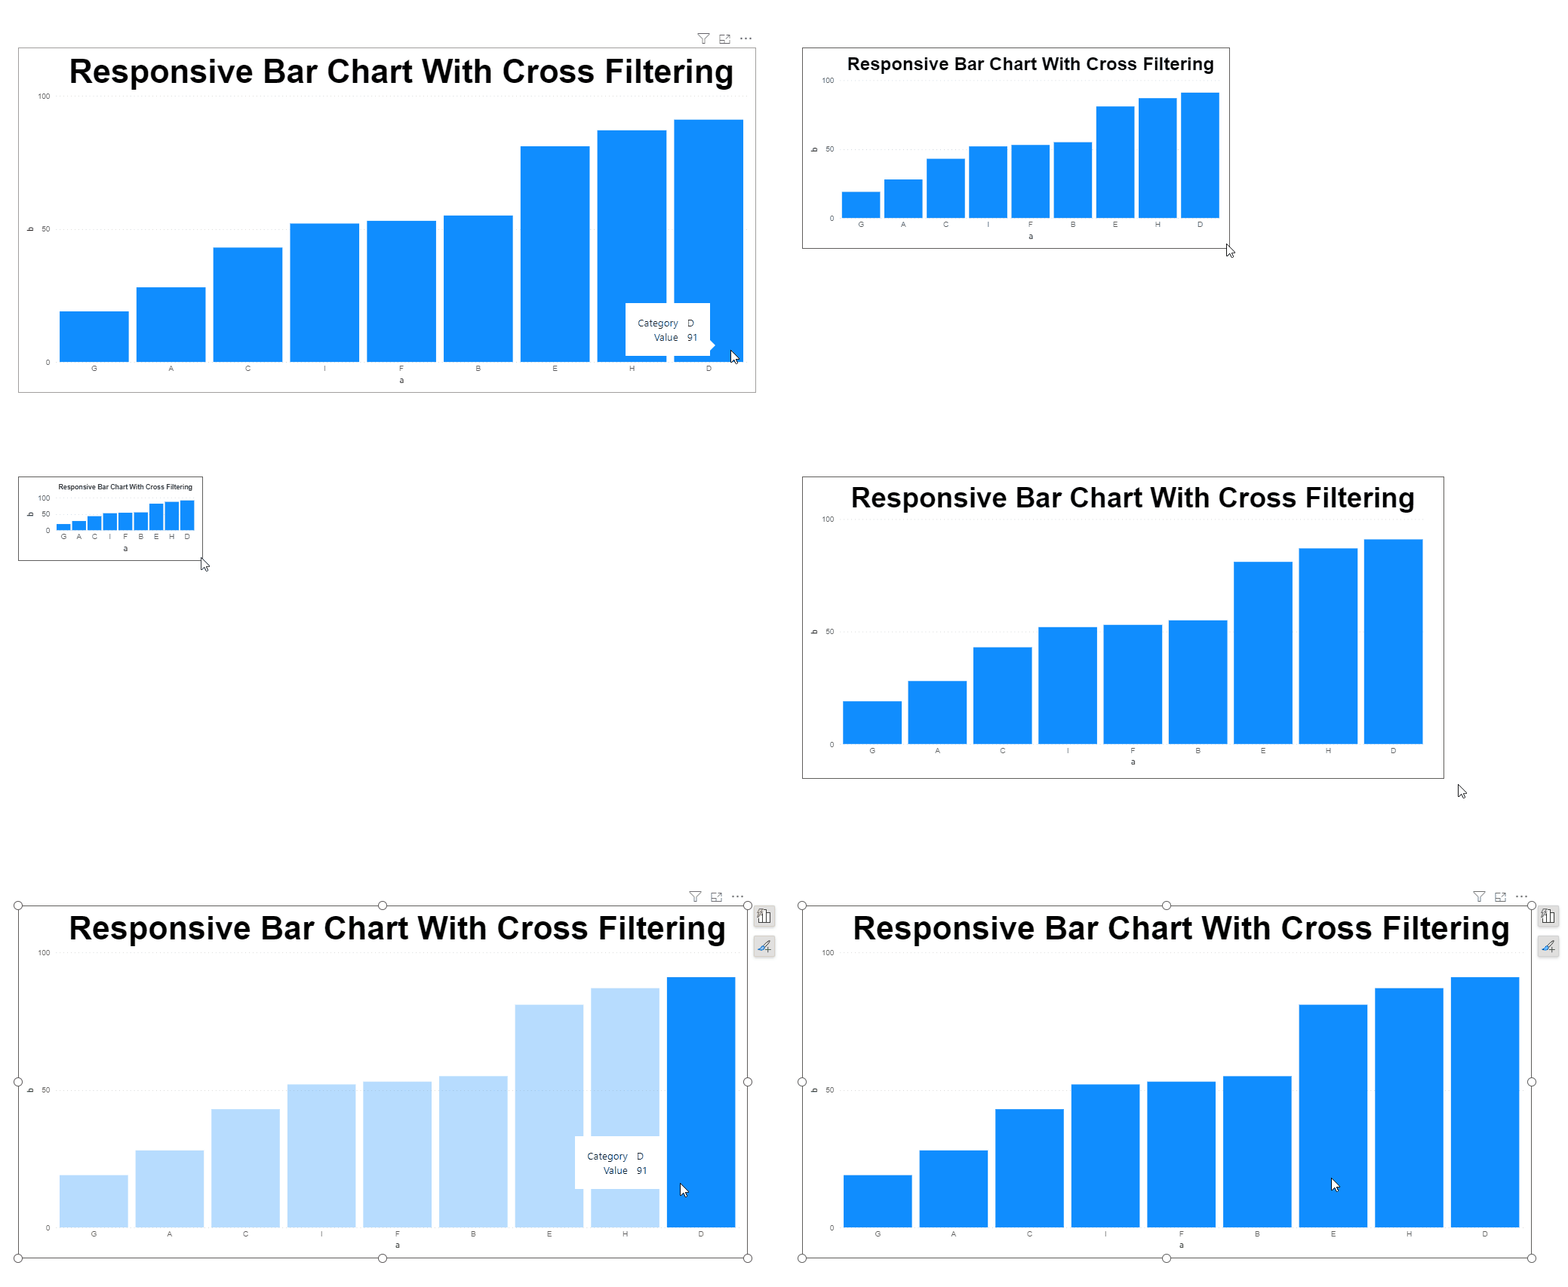
Interactive Responsive Bar Chart with Cross-Filtering Template
This interactive bar chart template, adapted from the official Vega-Lite example, is tailored for use with Deneb in Power BI. It features enhanced interactivity through cross-filtering, providing a dynamic data exploration experience. Additionally, this template utilizes Deneb’s specific function pbiColor(0) to dynamically adjust the color of the bars to the first color in the defined scheme.
Download the files used here
🔽 Responsive_Bar_Chart_With_Cross_Filtering.pbix (1.84 MB)
🔽 Template_Responsive_Bar_Chart_With_Cross_Filtering.json: (2.63 KB)
Copy Template
 {
  "$schema": "https://vega.github.io/schema/vega-lite/v5.json",
  "usermeta": {
    "deneb": {
      "build": "1.6.2.1",
      "metaVersion": 1,
      "provider": "vegaLite",
      "providerVersion": "5.16.3"
    },
    "interactivity": {
      "tooltip": true,
      "contextMenu": true,
      "selection": true,
      "highlight": false,
      "dataPointLimit": 50
    },
    "information": {
      "name": "Responsive Bar Chart With Cross Filtering",
      "description": "[No Description Provided]",
      "author": "Cristobal Salcedo Beltran",
      "uuid": "aa2d11a1-9a68-4555-b78d-fc4b77e70ffb",
      "generated": "2024-06-12T03:20:41.339Z"
    },
    "dataset": [
      {
        "key": "__0__",
        "name": "a",
        "description": "Categories represented on the X-axis",
        "type": "text",
        "kind": "column"
      },
      {
        "key": "__1__",
        "name": "b",
        "description": "Values represented on the Y-axis",
        "type": "numeric",
        "kind": "measure"
      }
    ]
  },
  "config": {
    "view": {"stroke": "transparent"},
    "background": "transparent",
    "title": {
      "fontSize": {"expr": "width/21"}
    },
    "axis": {
      "labelColor": "#605E5C",
      "labelFontSize": 12,
      "titleFontWeight": "normal"
    },
    "axisQuantitative": {
      "tickCount": 3,
      "grid": true,
      "gridColor": "#C8C6C4",
      "gridDash": [1, 5]
    },
    "axisX": {
      "labelPadding": 5,
      "labelAngle": 0
    },
    "axisY": {"labelPadding": 10},
    "bar": {
      "fill": {"expr": "pbiColor(0)"}
    }
  },
  "description": "This responsive bar chart visualizes the quantitative values of '__1__' for each categorical variable '__0__'. It allows users to interact with the data through tooltips, context menus, and selection features, facilitating cross-filtering and detailed analysis. Author: Cristobal Salcedo Beltran, Email: csalcedo90@gmail.com",
  "title": "Responsive Bar Chart With Cross Filtering",
  "data": {"name": "dataset"},
  "mark": "bar",
  "encoding": {
    "x": {
      "field": "__0__",
      "type": "nominal",
      "sort": {
        "field": "__1__",
        "order": "ascending"
      }
    },
    "y": {
      "field": "__1__",
      "type": "quantitative"
    },
    "tooltip": [
      {
        "field": "__0__",
        "type": "nominal",
        "title": "Category"
      },
      {
        "field": "__1__",
        "type": "quantitative",
        "title": "Value"
      }
    ],
    "opacity": {
      "condition": {
        "test": {
          "field": "__selected__",
          "equal": "off"
        },
        "value": 0.3
      },
      "value": 1
    }
  }
}
Esta entrada está licenciada bajo CC BY 4.0 por el autor.
