Grouped Bar Chart With Cross-Filtering Template
This Grouped Bar Chart With Cross-Filtering template is based on the official Vega-Lite example and has been adapted for Deneb in Power BI with added interactivity (cross-filtering).
Grouped Bar Chart With Cross-Filtering Template
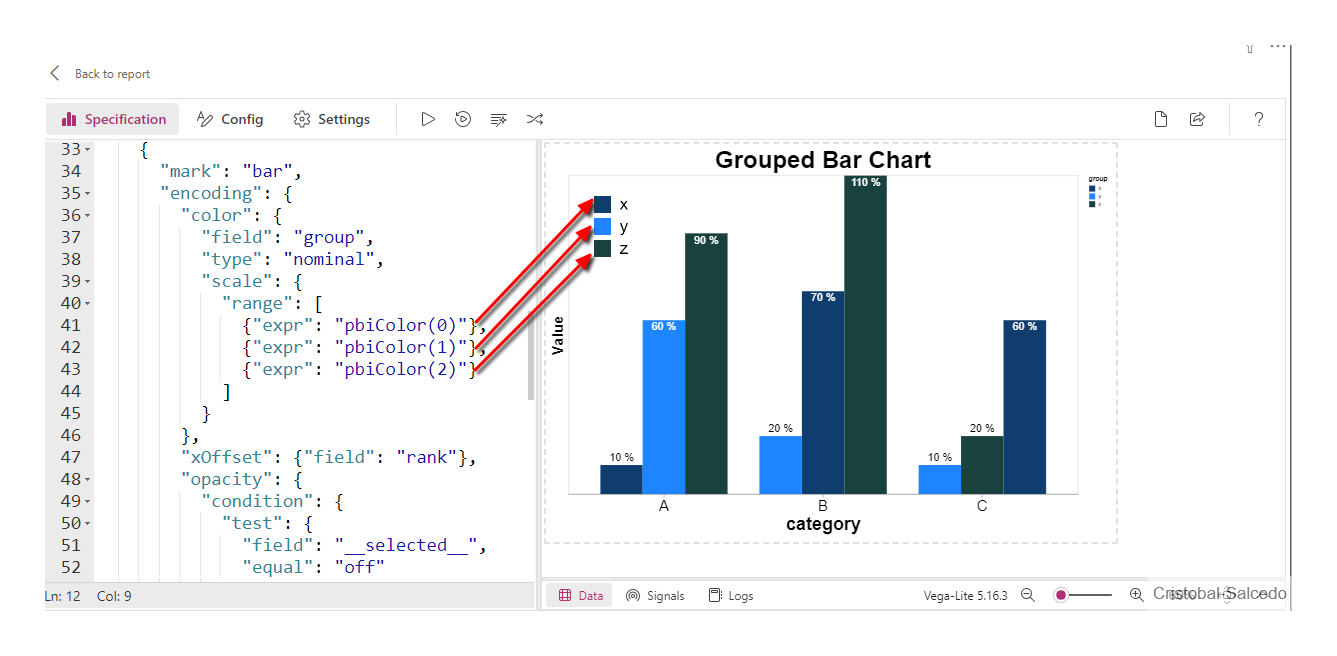
This interactive bar chart visualizes data by grouping categories and applying cross-filtering for enhanced data exploration. Based on the official Vega-Lite example and adapted for Deneb in Power BI, this chart features advanced cross-filtering and sorting capabilities. Enhanced labeling ensures improved clarity and usability. Additionally, the pbiColor function adjusts the bar colors according to the first, second, and third colors defined in the Power BI theme, ensuring a consistent and cohesive visual design.
pbiColor 👇😍
Download the files used here
🔽 Grouped_Bar_Chart_With_Cross_Filtering.pbix (4.31 MB)
🔽 Template_Grouped_Bar_Chart_With_Cross_Filtering_VegaLite.json: (4.01 KB)
References
- Vega-Lite Bar Grouped Example: This example showcases a grouped bar chart using Vega-Lite, providing the foundation for creating complex, interactive visualizations.
- Deneb Interactivity and Selection Guide: This guide details the implementation of interactivity and selection features in Deneb visualizations, enhancing chart functionality and user experience.
- Deneb Schemes: This resource offers insights into various schemes available in Deneb, helping to customize and improve the visual appeal of your charts.
Copy Template
{
  "$schema": "https://vega.github.io/schema/vega-lite/v5.json",
  "usermeta": {
    "deneb": {
      "build": "1.6.2.1",
      "metaVersion": 1,
      "provider": "vegaLite",
      "providerVersion": "5.16.3"
    },
    "interactivity": {
      "tooltip": true,
      "contextMenu": true,
      "selection": true,
      "highlight": false,
      "dataPointLimit": 50
    },
    "information": {
      "name": "Grouped Bar Chart with Cross-filtering",
      "description": "This template is reusable and consists of two categories and one measure. The Grouped Bar Chart is based on the official Vega-Lite example and has been adapted for Deneb in Power BI with enhanced interactivity, including cross-filtering capabilities. Author: Cristobal Salcedo Beltran",
      "author": "Cristobal Salcedo Beltrean",
      "uuid": "9568ac8f-463a-4f9b-9087-abc07ed474bd",
      "generated": "2024-06-28T03:05:30.856Z"
    },
    "dataset": [
      {
        "key": "__0__",
        "name": "Category",
        "description": "The primary classification for the data, representing different categories or segments being analyzed.",
        "type": "text",
        "kind": "column"
      },
      {
        "key": "__1__",
        "name": "group",
        "description": "A secondary classification within each category, used to differentiate data points within the same category",
        "type": "text",
        "kind": "column"
      },
      {
        "key": "__2__",
        "name": "Value",
        "description": "The quantitative measurement or metric that is being analyzed and compared across different categories and groups.",
        "type": "numeric",
        "kind": "measure"
      }
    ]
  },
  "config": {
    "axisX": {
      "titleFontSize": 18,
      "labelAngle": 0,
      "labelFontSize": 15
    },
    "axisY": {
      "titleFontSize": 15,
      "grid": false,
      "labels": false,
      "ticks": false,
      "domain": false
    }
  },
  "description": "This Grouped Bar Chart is based on the official Vega-Lite example and has been adapted for Deneb in Power BI with added interactivity (cross-filtering). Author: Cristobal Salcedo Beltran. Contact: csalcedo90@gmail.com.",
  "data": {"name": "dataset"},
  "title": {
    "text": "Grouped Bar Chart with Cross-filtering",
    "fontSize": 20
  },
  "transform": [
    {
      "window": [
        {
          "op": "rank",
          "as": "sortGroupCategory"
        }
      ],
      "sort": [
        {
          "field": "__2__",
          "order": "ascending"
        }
      ],
      "groupby": ["__0__"]
    },
    {
      "window": [
        {
          "op": "average",
          "field": "__2__",
          "as": "Average_Value"
        }
      ],
      "frame": [null, null]
    }
  ],
  "layer": [
    {
      "name": "Layer_Bars",
      "mark": "bar",
      "encoding": {
        "color": {
          "field": "__1__",
          "type": "nominal",
          "scale": {
            "range": [
              {"expr": "pbiColor(0)"},
              {"expr": "pbiColor(1)"},
              {"expr": "pbiColor(2)"}
            ]
          }
        },
        "xOffset": {
          "field": "sortGroupCategory"
        },
        "opacity": {
          "condition": {
            "test": {
              "field": "__selected__",
              "equal": "off"
            },
            "value": 0.3
          },
          "value": 1
        }
      }
    },
    {
      "name": "Layer_TextLabels",
      "mark": {
        "type": "text",
        "dy": {
          "expr": "datum['__2__'] > datum.Average_Value ? 18 : -15"
        },
        "color": {
          "expr": "datum['__2__'] > datum.Average_Value ? 'white' : 'black'"
        },
        "fontSize": 18
      },
      "encoding": {
        "xOffset": {
          "field": "sortGroupCategory"
        },
        "text": {
          "value": {
            "expr": "datum['__2__']__formatted"
          }
        }
      }
    }
  ],
  "encoding": {
    "x": {"field": "__0__"},
    "y": {
      "field": "__2__",
      "type": "quantitative",
      "title": "__2__"
    }
  }
}