Gantt Chart Template
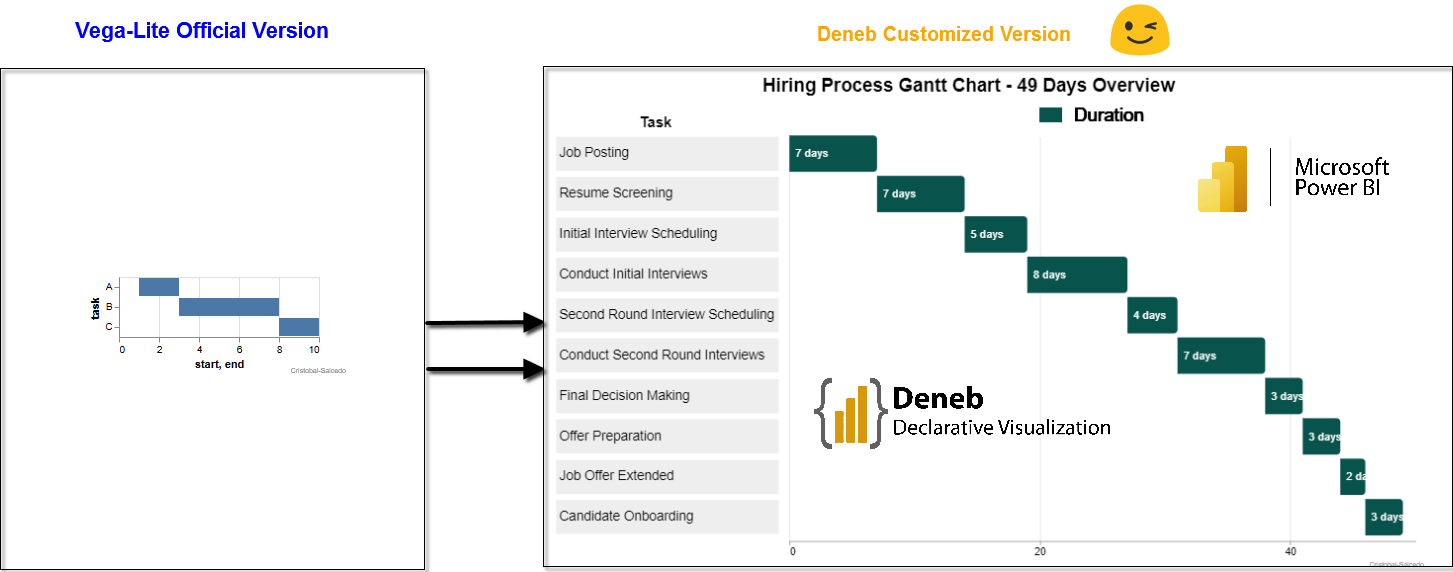
This Gantt chart template, adapted from Vega-Lite and customized for Deneb in Power BI, provides a clear and functional visualization. It includes labels within the bars showing the duration of each task and a descriptive title for easy understanding. Tasks are ordered on the Y-axis, with bars styled in dark green and rounded corners for a modern look. Additionally, cross-filtering interactivity is fully operational, making this chart applicable to any process that requires tracking the timing and sequence of activities. Author: Cristobal Salcedo Beltran. Contact: csalcedo90@gmail.com.
👀
Download the files used here
🔽 Gantt_Chart.pbix (2 MB)
🔽 Gantt_Chart.json: (5.55 KB)
References
Deneb Official Website: Official website for Deneb, providing comprehensive resources and documentation.
Vega-Lite Gantt Chart (Ranged Bar Marks) Example: This example showcases a Gantt chart using ranged bar marks in Vega-Lite, offering a foundational guide for creating detailed and complex project timelines.
Copy the Template Below👇✔
 {
  "$schema": "https://vega.github.io/schema/vega-lite/v5.json",
  "usermeta": {
    "information": {
      "uuid": "a1aa3117-60f0-4be2-9c86-992c757746f6",
      "generated": "2024-08-16T03:43:41.186Z",
      "previewImageBase64PNG": "data:image/png;base64,iVBORw0KGgoAAAANSUhEUgAAAAEAAAABCAQAAAC1HAwCAAAAC0lEQVR42mNkYAAAAAYAAjCB0C8AAAAASUVORK5CYII=",
      "name": "Gantt Chart",
      "description": "This Gantt chart template, adapted from Vega-Lite and customized for Deneb in Power BI, provides a clear and functional visualization.\nAuthor: Cristobal Salcedo Beltran. Contact: csalcedo90@gmail.com.",
      "author": "Cristobal Salcedo Beltran"
    },
    "deneb": {
      "build": "1.7.1.0",
      "metaVersion": 1,
      "provider": "vegaLite",
      "providerVersion": "5.20.1"
    },
    "interactivity": {
      "tooltip": true,
      "contextMenu": true,
      "selection": true,
      "selectionMode": "simple",
      "highlight": false,
      "dataPointLimit": 50
    },
    "config": "{\r\n  \"view\": {\r\n    \"stroke\": \"transparent\"\r\n  },\r\n  \"background\": \"transparent\",\r\n  \"axisX\": {\r\n    \"orient\": \"bottom\",\r\n    \"offset\": 5,\r\n    \"grid\": true,\r\n    \"tickRound\": true,\r\n    \"labelFontSize\": 14,\r\n    \"tickCount\": 2\r\n  },\r\n  \"axisY\": {\r\n    \"domain\": false,\r\n    \"tickWidth\": 46,\r\n    \"tickSize\": 300,\r\n    \"tickColor\": {\r\n      \"expr\": \"split(datum.value,'|')[0]=='on'?'#08534b': '#eee'\"\r\n    },\r\n    \"labelColor\": {\r\n      \"expr\": \"split(datum.value,'|')[0]=='on'?'white': 'black'\"\r\n    },\r\n    \"offset\": 15,\r\n    \"grid\": false,\r\n    \"tickRound\": true,\r\n    \"labelFontSize\": 18,\r\n    \"labelAlign\": \"left\",\r\n    \"labelLimit\": 370,\r\n    \"labelPadding\": -4,\r\n    \"titleAlign\": \"left\",\r\n    \"titleAnchor\": \"start\",\r\n    \"titleAngle\": 0,\r\n    \"titleFontSize\": 20,\r\n    \"titlePadding\": -12,\r\n    \"titleY\": -5\r\n  }\r\n}",
    "dataset": [
      {
        "key": "__0__",
        "name": "Task",
        "description": "",
        "kind": "column",
        "type": "text"
      },
      {
        "key": "__1__",
        "name": "End_Day",
        "description": "",
        "kind": "measure",
        "type": "numeric"
      },
      {
        "key": "__2__",
        "name": "Start_Day",
        "description": "",
        "kind": "measure",
        "type": "numeric"
      },
      {
        "key": "__3__",
        "name": "Task_Order",
        "description": "",
        "kind": "measure",
        "type": "numeric"
      },
      {
        "key": "__4__",
        "name": "Duration",
        "description": "",
        "kind": "measure",
        "type": "numeric"
      }
    ]
  },
  "description": "This Gantt chart template, adapted from Vega-Lite and customized for Deneb in Power BI, provides a clear and functional visualization. It includes labels within the bars showing the duration of each task and a descriptive title for easy understanding. Tasks are ordered on the Y-axis, with bars styled in dark green and rounded corners for a modern look. Additionally, cross-filtering interactivity is fully operational, making this chart applicable to any process that requires tracking the timing and sequence of activities. Author: Cristobal Salcedo Beltran. Contact: csalcedo90@gmail.com.",
  "data": {
    "name": "dataset"
  },
  "transform": [
    {
      "calculate": "datum.__selected__+'|'+ datum['__0__']",
      "as": "selectedTask"
    }
  ],
  "encoding": {
    "y": {
      "field": "selectedTask",
      "type": "ordinal",
      "axis": {
        "title": "__0__",
        "labelExpr": "split(datum.value,'|')[1]"
      },
      "sort": {
        "field": "__3__"
      }
    },
    "x": {
      "field": "__2__",
      "type": "quantitative"
    },
    "x2": {
      "field": "__1__",
      "type": "quantitative",
      "title": ""
    }
  },
  "layer": [
    {
      "name": "Mark_barLegend",
      "mark": {
        "type": "bar",
        "color": "#08534b",
        "height": 20,
        "width": 10
      },
      "encoding": {
        "x": {
          "value": {
            "expr": "width/2.5"
          }
        },
        "x2": {
          "value": {
            "expr": "width/2.3"
          }
        },
        "y": {
          "value": -25
        }
      }
    },
    {
      "name": "Mark_textLegend",
      "mark": {
        "type": "text",
        "align": "left",
        "color": "#020202",
        "fontSize": 25
      },
      "encoding": {
        "text": {
          "value": "__4__"
        },
        "x": {
          "value": {
            "expr": "width/2.2"
          }
        },
        "y": {
          "value": -25
        }
      }
    },
    {
      "name": "Mark_barChart",
      "mark": {
        "type": "bar",
        "color": "#08534b",
        "cornerRadiusTopRight": 5,
        "cornerRadiusBottomRight": 5
      },
      "encoding": {
        "opacity": {
          "condition": {
            "test": {
              "field": "__selected__",
              "equal": "off"
            },
            "value": 0.3
          },
          "value": 1
        }
      }
    },
    {
      "name": "Mark_textChart",
      "mark": {
        "type": "text",
        "fontSize": 15,
        "align": "left",
        "color": "#fff",
        "dx": 8
      },
      "encoding": {
        "text": {
          "value": {
            "expr": "datum['__4__'] +' days'"
          }
        }
      }
    }
  ],
  "title": {
    "text": "Hiring Process Gantt Chart - 49 Days Overview",
    "fontSize": 25,
    "anchor": "middle",
    "frame": "bounds",
    "offset": 15
  }
}