Dynamic Bar Chart: Encoding Colors with Hexadecimal or Color Names Based on Data Categories Template
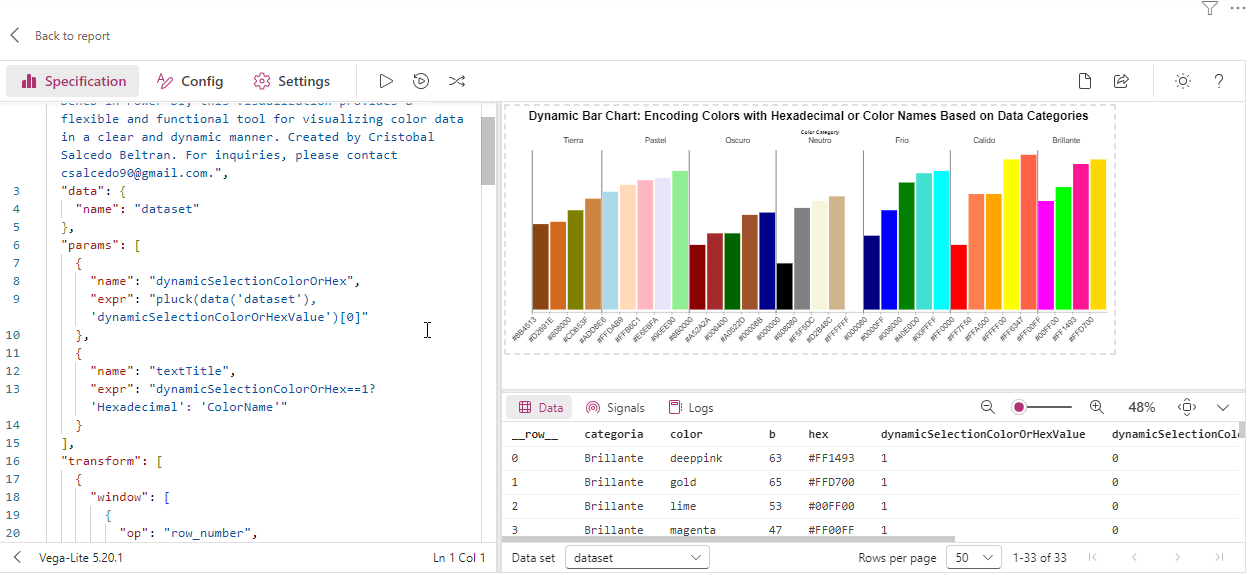
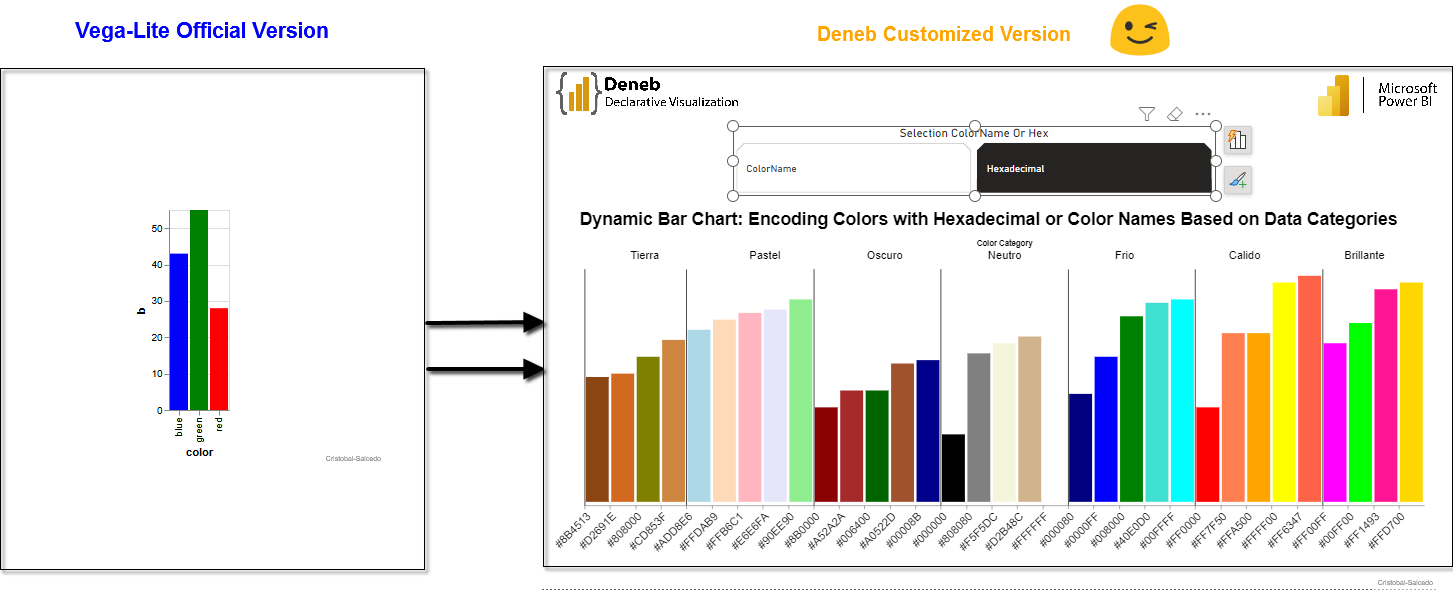
This template showcases a Dynamic Bar Chart that encodes colors using either Hexadecimal values or Color Names, based on data categories. Adapted from a Vega-Lite example and customized for use with Deneb in Power BI, this visualization provides a flexible and functional tool for visualizing color data in a clear and dynamic manner. Created by Cristobal Salcedo Beltran. For inquiries, please contact csalcedo90@gmail.com
👀
Download the files used here
🔽 Dynamic_Bar_Chart_Encoding_Colors_with_Hexadecimal_or_Color_Names_Based_on_Data_Categories.pbix (2.83 MB)
🔽 Dynamic_Bar_Chart_Encoding_Colors_with_Hexadecimal_or_Color_Names_Based_on_Data_Categories.json: (5.52 KB)
References
Deneb Official Website: Official website for Deneb, providing comprehensive resources and documentation.
Vega-Lite A Bar Chart Encoding Color Names in the Data Example: This example demonstrates a bar chart that directly encodes color names from the data, providing a clear visual representation of categorical color information.
Copy the Template Below👇✔
 {
  "$schema": "https://vega.github.io/schema/vega-lite/v5.json",
  "usermeta": {
    "information": {
      "uuid": "df299bc7-56b1-4b07-a66e-fa36784d71d6",
      "generated": "2024-08-27T04:08:59.001Z",
      "previewImageBase64PNG": "data:image/png;base64,iVBORw0KGgoAAAANSUhEUgAAAAEAAAABCAQAAAC1HAwCAAAAC0lEQVR42mNkYAAAAAYAAjCB0C8AAAAASUVORK5CYII=",
      "name": "Dynamic Bar Chart: Encoding Colors with Hexadecimal or Color Names Based on Data Categories",
      "description": "Dynamic Bar Chart template encoding colors as Hexadecimal or Color Names, based on data categories. Adapted from Vega-Lite and customized for Deneb in Power BI. A flexible tool for clear, dynamic color visualization. By Cristobal Salcedo Beltran.",
      "author": "Cristobal-Salcedo"
    },
    "deneb": {
      "build": "1.7.1.0",
      "metaVersion": 1,
      "provider": "vegaLite",
      "providerVersion": "5.20.1"
    },
    "interactivity": {
      "tooltip": true,
      "contextMenu": true,
      "selection": false,
      "selectionMode": "simple",
      "highlight": false,
      "dataPointLimit": 50
    },
    "config": "{\r\n  \"background\": \"transparent\",\r\n  \"view\": {\r\n    \"stroke\": \"transparent\"\r\n  },\r\n  \"axisX\": {\r\n    \"labelAngle\": -45,\r\n    \"labelFontSize\": 16,\r\n    \r\n    \"grid\": true,\r\n    \"offset\": 5\r\n  },\r\n  \"axisY\": {\r\n    \"labels\": false,\r\n    \"grid\": false,\r\n    \"domain\": false,\r\n    \"ticks\": false,\r\n    \"offset\": 5\r\n  }\r\n}",
    "dataset": [
      {
        "key": "__0__",
        "name": "categoria",
        "description": "",
        "kind": "column",
        "type": "text"
      },
      {
        "key": "__1__",
        "name": "ValueColorName",
        "description": "",
        "kind": "column",
        "type": "text"
      },
      {
        "key": "__2__",
        "name": "Value",
        "description": "",
        "kind": "column",
        "type": "numeric"
      },
      {
        "key": "__3__",
        "name": "ValueHexadecimal",
        "description": "",
        "kind": "column",
        "type": "text"
      },
      {
        "key": "__4__",
        "name": "dynamicSelectionColorOrHexValue",
        "description": "",
        "kind": "measure",
        "type": "numeric"
      }
    ]
  },
  "description": "This template showcases a Dynamic Bar Chart that encodes colors using either Hexadecimal values or Color Names, based on data categories. Adapted from a Vega-Lite example and customized for use with Deneb in Power BI, this visualization provides a flexible and functional tool for visualizing color data in a clear and dynamic manner. Created by Cristobal Salcedo Beltran. For inquiries, please contact csalcedo90@gmail.com.",
  "data": {
    "name": "dataset"
  },
  "params": [
    {
      "name": "dynamicSelectionColorOrHex",
      "expr": "pluck(data('dataset'),'dynamicSelectionColorOrHexValue')[0]"
    },
    {
      "name": "textTitle",
      "expr": "dynamicSelectionColorOrHex==1? 'Hexadecimal': 'ColorName'"
    }
  ],
  "transform": [
    {
      "window": [
        {
          "op": "row_number",
          "field": "__2__",
          "as": "rowOrder"
        }
      ],
      "frame": [
        null,
        null
      ],
      "sort": [
        {
          "field": "__0__",
          "order": "descending"
        },
        {
          "field": "__2__",
          "order": "ascending"
        }
      ]
    },
    {
      "window": [
        {
          "op": "row_number",
          "field": "__2__",
          "as": "categoryOrder"
        }
      ],
      "frame": [
        null,
        null
      ],
      "sort": [
        {
          "field": "__0__",
          "order": "descending"
        },
        {
          "field": "__2__",
          "order": "ascending"
        }
      ],
      "groupby": [
        "__0__"
      ]
    },
    {
      "calculate": "dynamicSelectionColorOrHex==1?datum['__3__']: datum['__1__']",
      "as": "finalColor"
    },
    {
      "calculate": "datum.categoryOrder+'|'+datum.finalColor",
      "as": "categoryColorLabel"
    }
  ],
  "layer": [
    {
      "name": "BARCHART",
      "mark": "bar",
      "encoding": {
        "x": {
          "field": "categoryColorLabel",
          "type": "nominal",
          "sort": {
            "field": "rowOrder"
          },
          "axis": {
            "tickOffset": -18,
            "gridColor": {
              "expr": "split(datum.value,'|')[0]==1? 'black':'transparent'"
            },
            "labelExpr": "split(datum.value,'|')[1]",
            "title": null
          }
        },
        "y": {
          "field": "__2__",
          "type": "quantitative",
          "title": " "
        },
        "color": {
          "field": "finalColor",
          "type": "nominal",
          "scale": null
        }
      }
    },
    {
      "name": "TextCategoria",
      "mark": {
        "type": "text"
      },
      "encoding": {
        "x": {
          "field": "__0__",
          "type": "nominal",
          "sort": {
            "field": "rowOrder"
          },
          "axis": {
            "labelAngle": 0,
            "orient": "top",
            "domain": false,
            "grid": false,
            "tickSize": 0,
            "title": "Color Category"
          }
        }
      }
    }
  ],
  "resolve": {
    "scale": {
      "x": "independent",
      "y": "independent"
    }
  },
  "title": {
    "text": "Dynamic Bar Chart: Encoding Colors with Hexadecimal or Color Names Based on Data Categories",
    "fontSize": 25,
    "anchor": "middle",
    "frame": "bounds",
    "offset": 15
  }
}