Grouped Bar Chart (Multiple Measure with Repeat Template
This Grouped Bar Chart template is based on the official Vega-Lite example and has been adapted for Deneb in Power BI. Note that cross-filtering interactivity is not possible due to the use of the ‘repeat’ function.
Publicado 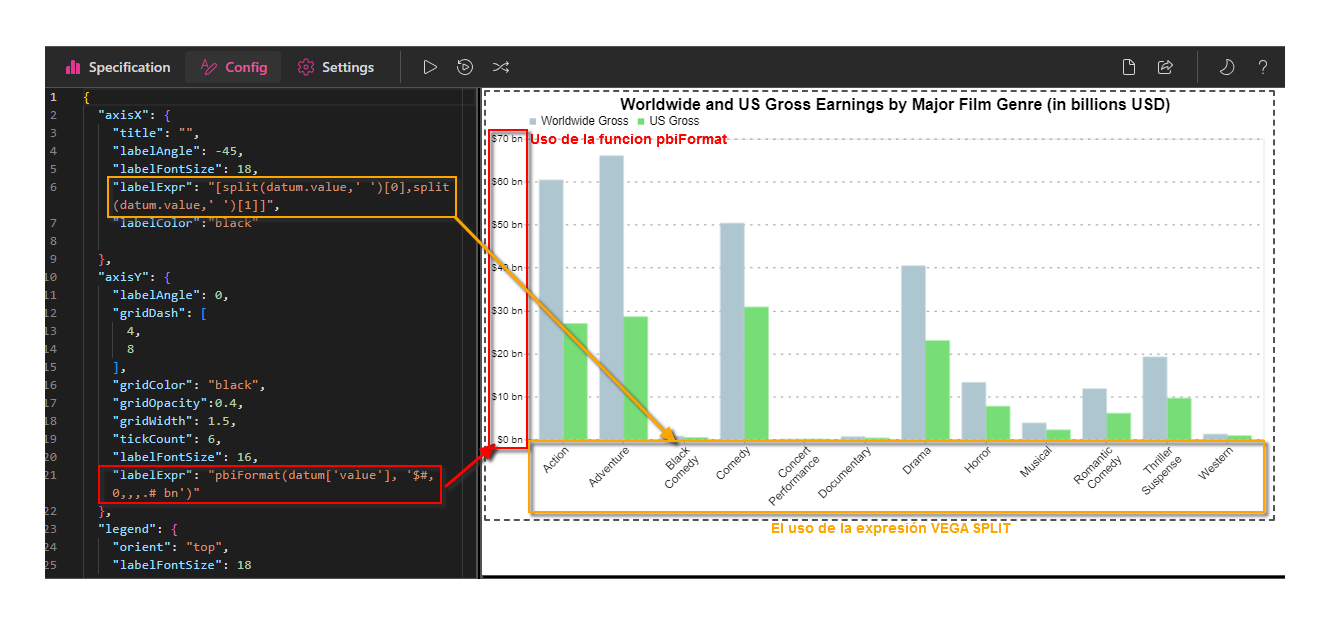
Grouped Bar Chart (Multiple Measure with Repeat)
Por Cristobal Salcedo Beltran
2 min de lectura
Grouped Bar Chart (Multiple Measures with Repeat Template)
Based on the official Vega-Lite example and adapted for Deneb in Power BI, this template provides a powerful visualization tool. Note that cross-filtering interactivity is not possible due to the use of the ‘repeat’ function.
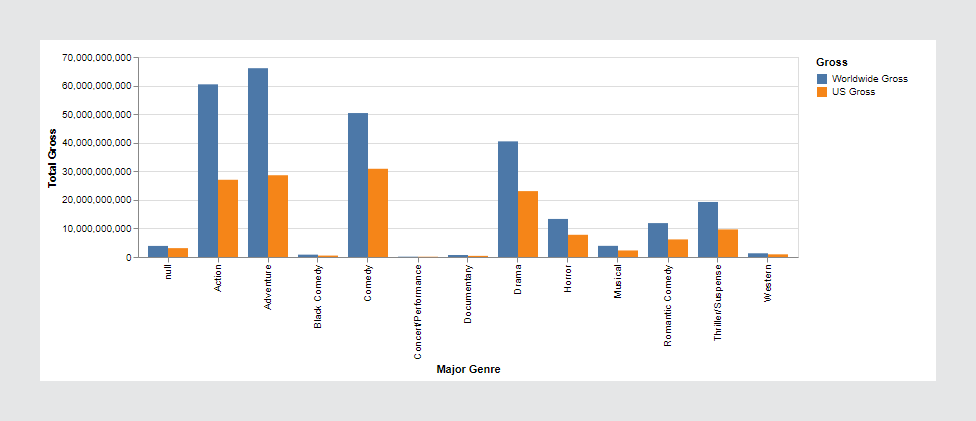
official Vega-Lite👇
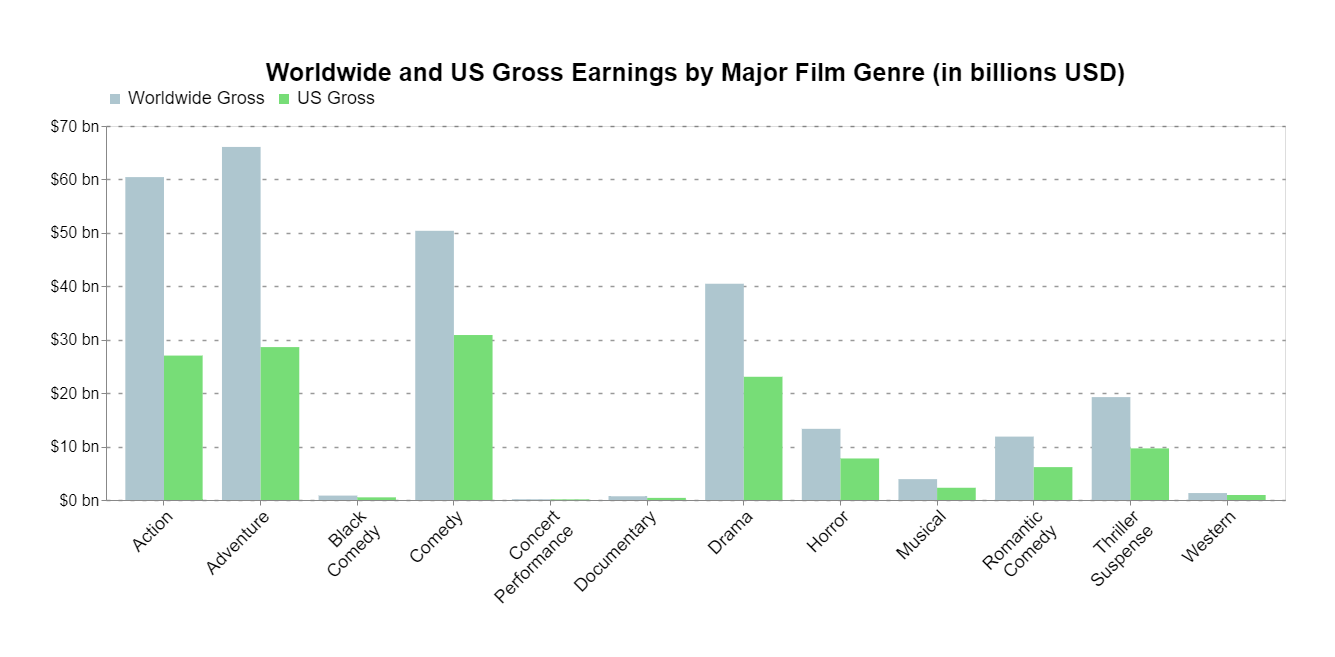
Adapted for Deneb in Power BI 👇😍
Download the files used here
🔽 Grouped_Bar_Chart_(Multiple_Measure_With_Repeat.pbix (4.85 MB)
🔽 Template_Grouped_Bar_Chart_(Multiple_Measure_With_Repeat_VegaLite.json: (3.17 KB)
References
- Grouped Bar Chart (Multiple Measures with Repeat): This example showcases a Grouped Bar Chart using Vega-Lite, providing the foundation for creating complex visualizations.
- Advanced Options for pbiFormat Function: A detailed guide on using the pbiFormat function for advanced formatting options.
- Deneb Formatting: A comprehensive resource on formatting techniques in Deneb.
- Deneb Schemes: This resource offers insights into various schemes available in Deneb, helping to customize and enhance the visual appeal of your charts.
Copy Template
{
  "$schema": "https://vega.github.io/schema/vega-lite/v5.json",
  "usermeta": {
    "deneb": {
      "build": "1.6.2.1",
      "metaVersion": 1,
      "provider": "vegaLite",
      "providerVersion": "5.16.3"
    },
    "interactivity": {
      "tooltip": true,
      "contextMenu": true,
      "selection": false,
      "highlight": false,
      "dataPointLimit": 50
    },
    "information": {
      "name": "Grouped Bar Chart (Multiple Measure with Repeat)",
      "description": "Based on an official Vega-Lite example and adapted for use in Deneb within Power BI, it should be noted that cross-filtering interactivity is limited when using 'repeat'. Author: Cristobal Salcedo Beltran. Contact: csalcedo90@gmail.com.",
      "author": "Cristobal Salcedo Beltran",
      "uuid": "3daea56b-488c-467b-9627-5cf0d503e056",
      "generated": "2024-07-04T05:32:15.995Z"
    },
    "dataset": [
      {
        "key": "__0__",
        "name": "Major Genre",
        "description": "Primary classification of the data, representing different genres or segments.",
        "type": "text",
        "kind": "column"
      },
      {
        "key": "__1__",
        "name": "US Gross",
        "description": "Quantitative measurement",
        "type": "numeric",
        "kind": "measure"
      },
      {
        "key": "__2__",
        "name": "Worldwide Gross",
        "description": "Quantitative measurement",
        "type": "numeric",
        "kind": "measure"
      }
    ]
  },
  "config": {
    "axisX": {
      "title": "",
      "labelAngle": -45,
      "labelFontSize": 18,
      "labelExpr": "[split[datum.value,' '](0),split[datum.value,' '](1)]",
      "labelColor": "black"
    },
    "axisY": {
      "labelAngle": 0,
      "gridDash": [4, 8],
      "gridColor": "black",
      "gridOpacity": 0.4,
      "gridWidth": 1.5,
      "tickCount": 6,
      "labelFontSize": 16,
      "labelExpr": "pbiFormat(datum['value'], '$#,0,,,.# bn')"
    },
    "legend": {
      "orient": "top",
      "labelFontSize": 18
    }
  },
  "description": "This Grouped Bar Chart (Multiple Measure with Repeat) visualizes the Worldwide and US Gross Earnings by Major Film Genre. Based on an official Vega-Lite example and adapted for use in Deneb within Power BI, it should be noted that cross-filtering interactivity is limited when using 'repeat'. Author: Cristobal Salcedo Beltran. Contact: csalcedo90@gmail.com.",
  "data": {"name": "dataset"},
  "title": {
    "text": "Worldwide and US Gross Earnings by Major Film Genre (in billions USD)",
    "fontSize": 25
  },
  "transform": [
    {"filter": "datum['__0__']!== null"}
  ],
  "repeat": {
    "layer": ["__2__", "__1__"]
  },
  "spec": {
    "mark": {"type": "bar"},
    "encoding": {
      "x": {
        "field": "__0__",
        "type": "nominal"
      },
      "y": {
        "aggregate": "sum",
        "field": {"repeat": "layer"},
        "type": "quantitative",
        "title": ""
      },
      "color": {
        "datum": {"repeat": "layer"},
        "type": "nominal",
        "scale": {
          "range": [
            {"expr": "pbiColor(0)"},
            {"expr": "pbiColor(1)"}
          ]
        }
      },
      "xOffset": {
        "datum": {"repeat": "layer"}
      }
    }
  }
}
Esta entrada está licenciada bajo CC BY 4.0 por el autor.