Interactive Aggregate Bar Chart Template with Cross-Filtering and Sorting
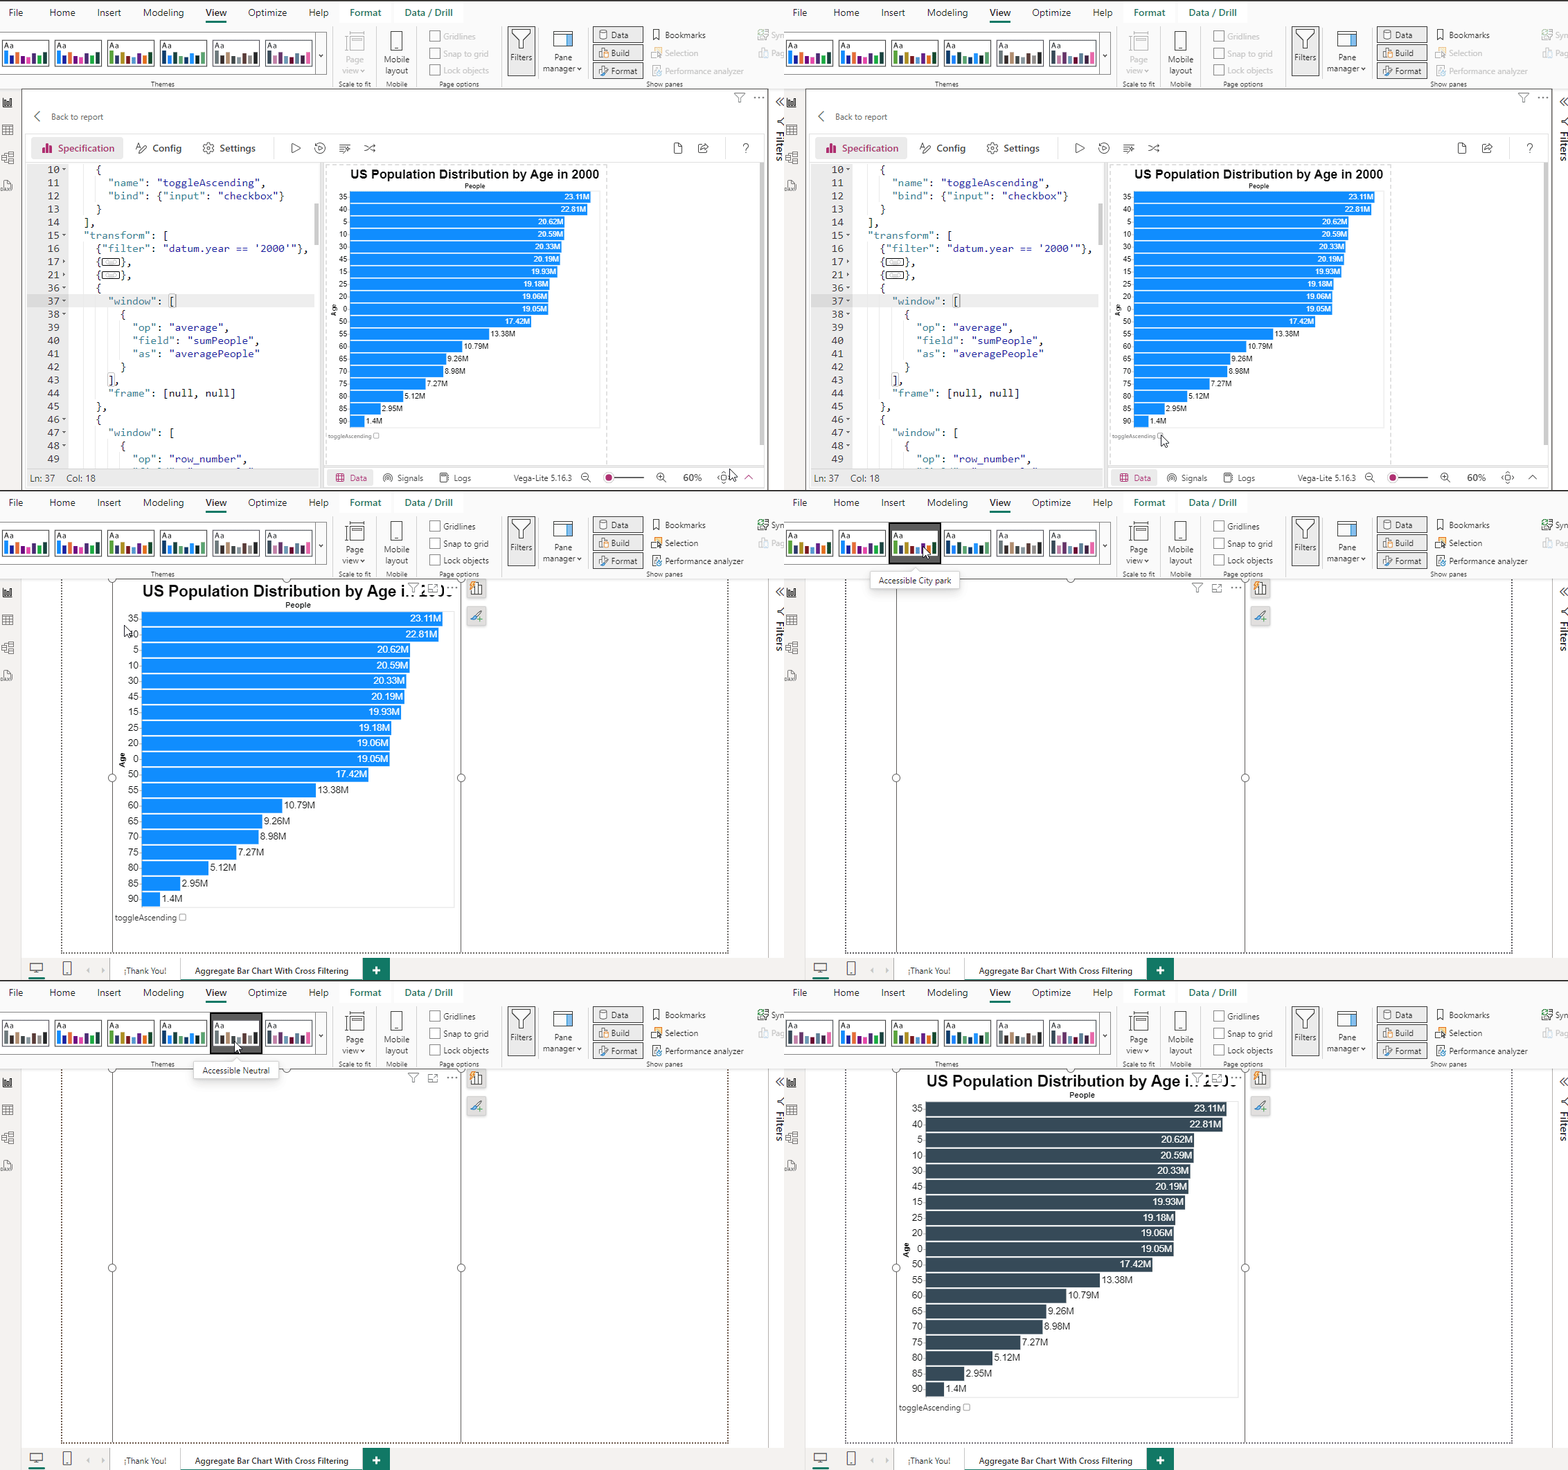
An in-depth look at the US population distribution by age in 2000 through an interactive bar chart with cross-filtering and sorting capabilities.
Interactive Aggregate Bar Chart with Cross-Filtering and Sorting
The interactive bar chart below provides a detailed visualization of the US population distribution by age groups in the year 2000. Created using Vega-Lite and adapted for Deneb in Power BI, this chart features cross-filtering and sorting capabilities, along with enhanced labeling for improved clarity and usability. Additionally, the use of the pbiColor function adapts the color of the bars according to the first color defined in the Power BI theme, ensuring a consistent and cohesive visual design.
Download the Files
🔽 Aggregate_Bar_Chart_With_Cross_Filtering_Sorted.pbix (2.01 MB)
🔽 Template_Aggregate_Bar_Chart_With_Cross_Filtering_Sorted.json (5.44 KB)
Copy Template
 {
  "$schema": "https://vega.github.io/schema/vega-lite/v5.json",
  "usermeta": {
    "deneb": {
      "build": "1.6.2.1",
      "metaVersion": 1,
      "provider": "vegaLite",
      "providerVersion": "5.16.3"
    },
    "interactivity": {
      "tooltip": true,
      "contextMenu": true,
      "selection": true,
      "highlight": false,
      "dataPointLimit": 50
    },
    "information": {
      "name": "Aggregate Bar Chart With Cross Filtering + Sorted",
      "description": "Example of Vega-Lite adapted to Deneb in Power BI, with cross-filtering + sorted, labels improved with the pbiFormat function, aligned to the right and left for better visualization, in the bars with white and black color. Author: Cristobal Salcedo Beltran, Email: csalcedo90@gmail.com",
      "author": "Cristobal Salcedo Beltran",
      "uuid": "f3e4ae59-7583-4602-be9f-1597f9dbdc9d",
      "generated": "2024-06-20T04:11:02.703Z"
    },
    "dataset": [
      {
        "key": "__0__",
        "name": "year",
        "description": "",
        "type": "text",
        "kind": "column"
      },
      {
        "key": "__1__",
        "name": "age",
        "description": "",
        "type": "numeric",
        "kind": "column"
      },
      {
        "key": "__2__",
        "name": "people",
        "description": "",
        "type": "numeric",
        "kind": "column"
      },
      {
        "key": "__3__",
        "name": "sex",
        "description": "",
        "type": "numeric",
        "kind": "column"
      }
    ]
  },
  "config": {
    "bar": {
      "color": {"expr": "pbiColor(0)"}
    },
    "axisY": {
      "labelFontSize": 18,
      "titleFontSize": 15,
      "grid": false,
      "tickCount": 6
    }
  },
  "description": "Aggregate Bar Chart With Cross Filtering + Sorted. A bar chart showing the US population distribution by age groups in the year 2000. Example of Vega-Lite adapted to Deneb in Power BI, with cross-filtering, labels improved with the pbiFormat function, aligned to the right and left for better visualization, in the bars with white and black color. Author: Cristobal Salcedo Beltran, Email: csalcedo90@gmail.com",
  "title": {
    "text": "US Population Distribution by Age in 2000",
    "anchor": "middle",
    "fontSize": 30
  },
  "data": {"name": "dataset"},
  "params": [
    {
      "name": "toggleAscending",
      "bind": {"input": "checkbox"}
    }
  ],
  "transform": [
    {
      "filter": "datum['__0__'] == '2000'"
    },
    {
      "calculate": "datum.__selected__=='off'? 0: datum['__2__']",
      "as": "Selected_People"
    },
    {
      "aggregate": [
        {
          "op": "sum",
          "field": "__2__",
          "as": "sumPeople"
        },
        {
          "op": "sum",
          "field": "Selected_People",
          "as": "Selected_People"
        }
      ],
      "groupby": ["__1__"]
    },
    {
      "window": [
        {
          "op": "average",
          "field": "sumPeople",
          "as": "averagePeople"
        }
      ],
      "frame": [null, null]
    },
    {
      "window": [
        {
          "op": "row_number",
          "field": "sumPeople",
          "as": "ascendingSumPeople"
        }
      ],
      "sort": [
        {
          "field": "sumPeople",
          "order": "ascending"
        }
      ],
      "frame": [null, null]
    },
    {
      "window": [
        {
          "op": "row_number",
          "field": "sumPeople",
          "as": "descendingSumPeople"
        }
      ],
      "sort": [
        {
          "field": "sumPeople",
          "order": "descending"
        }
      ],
      "frame": [null, null]
    },
    {
      "calculate": "toggleAscending? datum.ascendingSumPeople: datum.descendingSumPeople",
      "as": "Order"
    }
  ],
  "height": {"step": 30},
  "layer": [
    {
      "description": "Dimmed Bar; width = sum of people",
      "mark": {
        "type": "bar",
        "opacity": 0.3,
        "tooltip": true
      },
      "encoding": {
        "x": {
          "field": "sumPeople",
          "type": "quantitative",
          "title": "People",
          "axis": {
            "titleFontSize": 15,
            "labels": false,
            "domain": false,
            "ticks": false,
            "orient": "top"
          }
        }
      }
    },
    {
      "description": "Fully Opaque Bar; width = Selected_People",
      "mark": {"type": "bar"},
      "encoding": {
        "x": {
          "type": "quantitative",
          "field": "Selected_People"
        }
      }
    },
    {
      "name": "labels",
      "description": "Labels",
      "mark": {
        "type": "text",
        "align": {
          "expr": "datum.sumPeople>datum.averagePeople?'right':'left'"
        },
        "dx": {
          "expr": "datum.sumPeople>datum.averagePeople?-3:3"
        },
        "color": {
          "expr": "datum.sumPeople>datum.averagePeople?'white':'black'"
        },
        "fontSize": 18
      },
      "encoding": {
        "text": {
          "value": {
            "expr": "pbiFormat(datum.sumPeople, '#,0,,.0#M')"
          }
        },
        "x": {
          "field": "sumPeople",
          "type": "quantitative",
          "axis": {
            "labels": false,
            "domain": false,
            "ticks": false,
            "grid": false
          }
        }
      }
    }
  ],
  "encoding": {
    "y": {
      "field": "__1__",
      "title": "Age",
      "type": "ordinal",
      "sort": {
        "op": "max",
        "field": "Order",
        "order": "ascending"
      }
    }
  }
}
