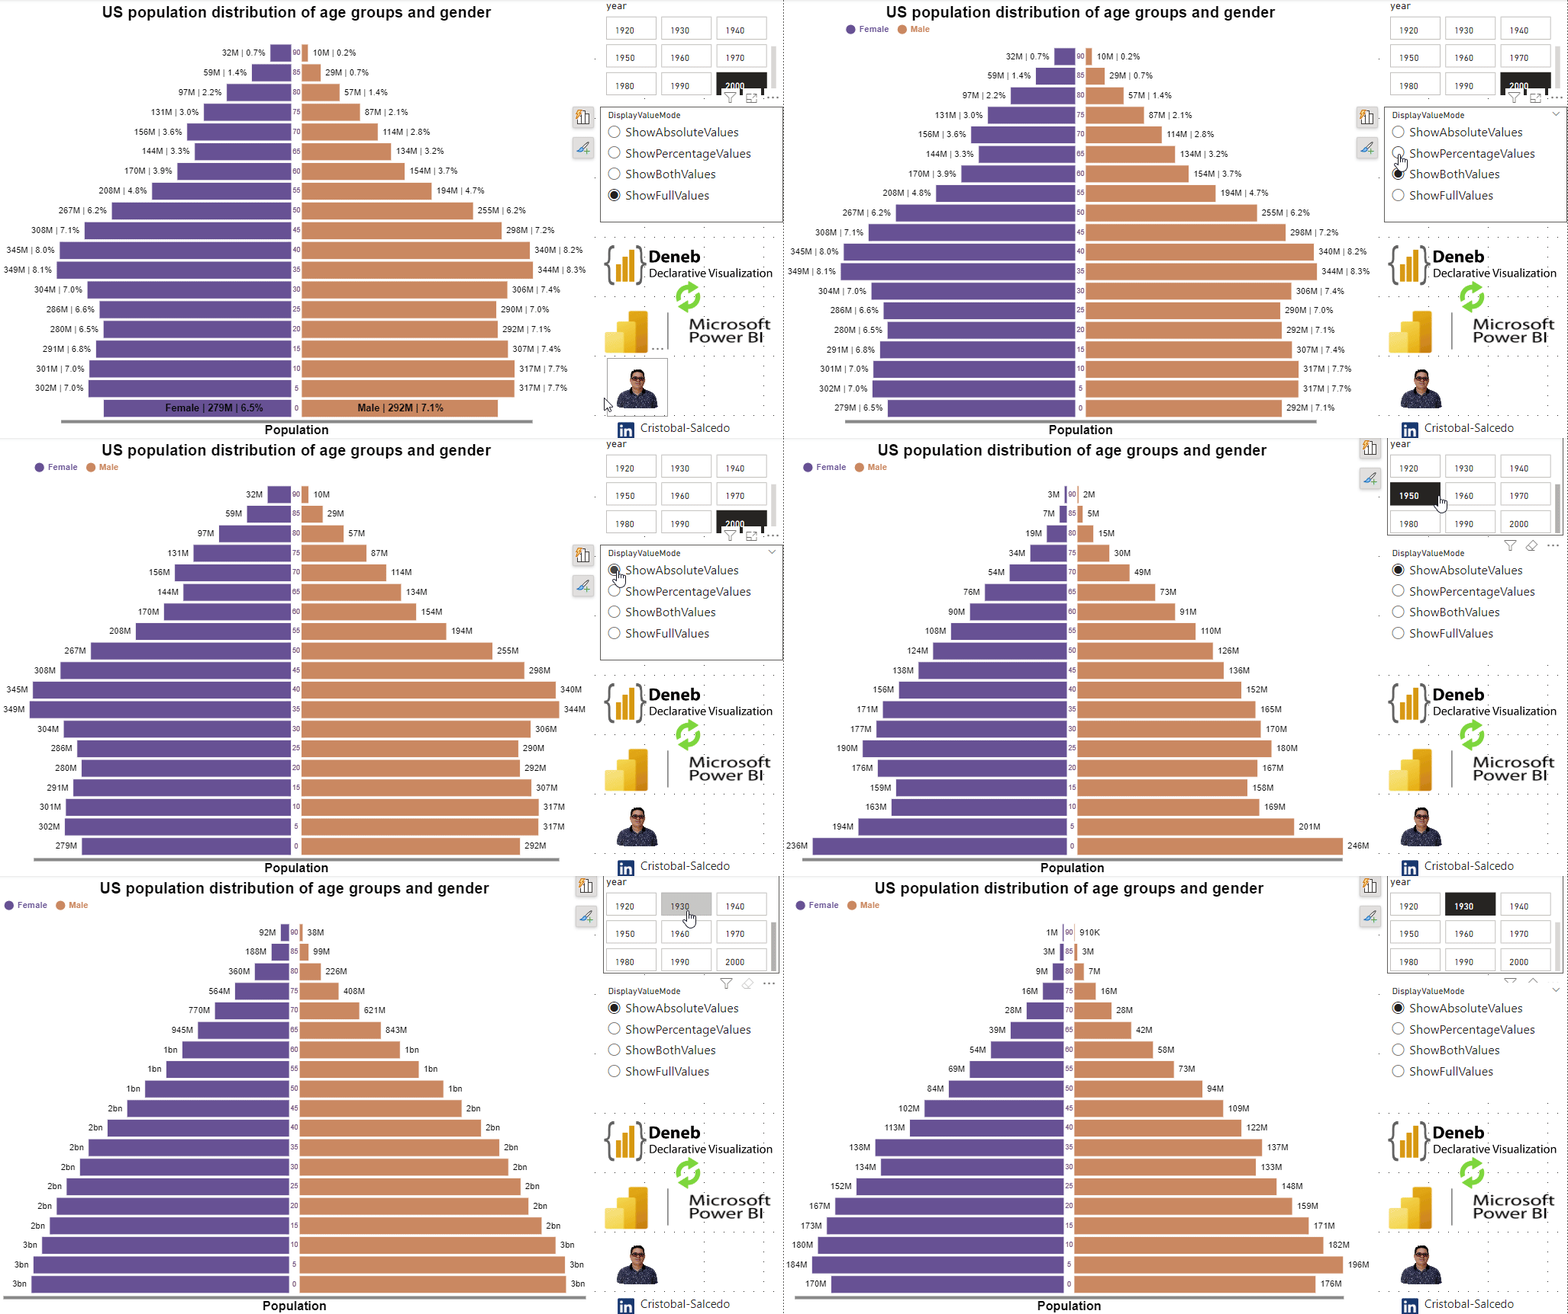
Gráfico de Pirámide de Población con Barras Apiladas Divergentes
Aprende a mejorar la presentación y precisión de tus gráficos en Power BI utilizando Vega-Lite y Deneb.

Aprende a mejorar la presentación y precisión de tus gráficos en Power BI utilizando Vega-Lite y Deneb.
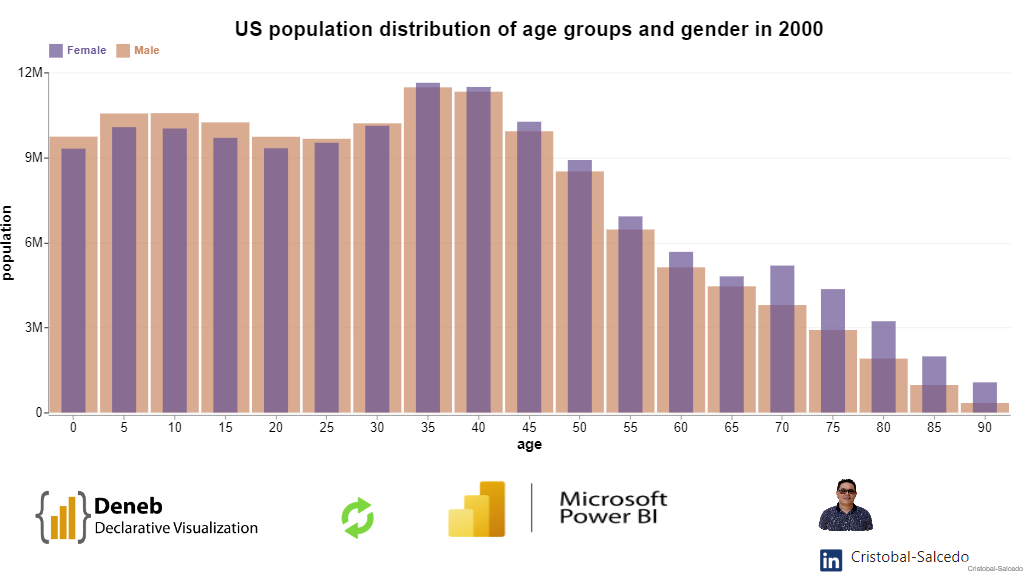
Descubre cómo mejorar la presentación y precisión de tus gráficos en Power BI con el control detallado de los ejes usando Vega-Lite y Deneb. Aprende a formatear y personalizar tus visuales para obt...
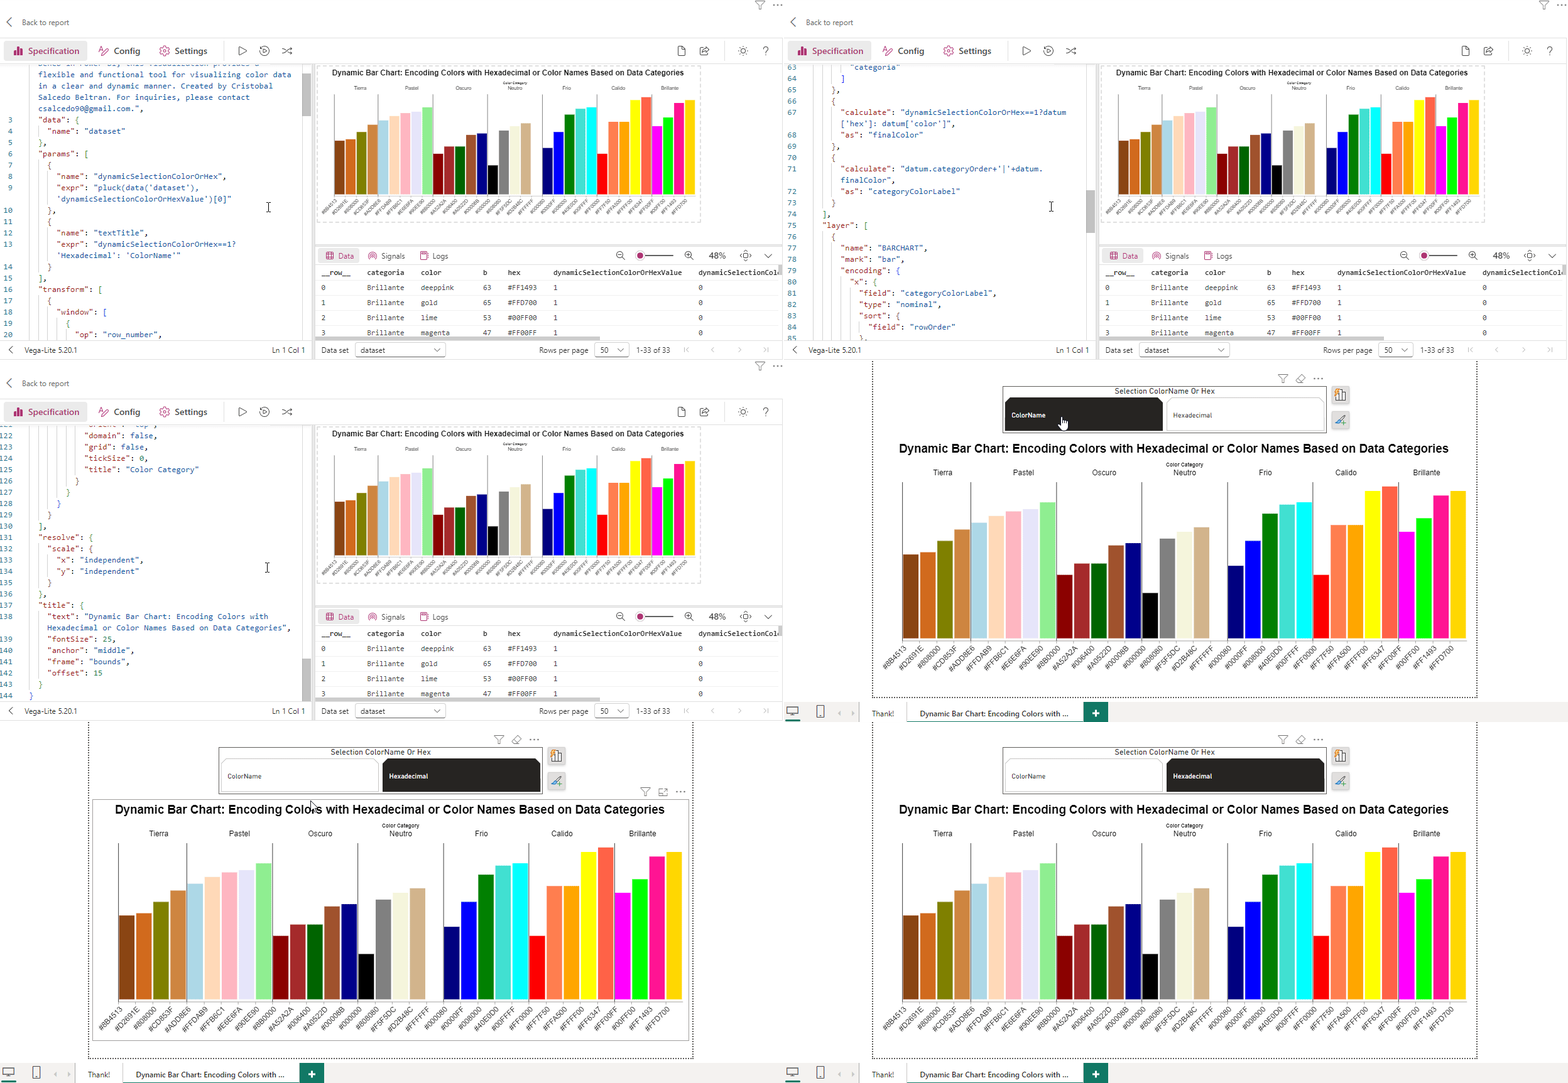
This template showcases a Dynamic Bar Chart that encodes colors using either Hexadecimal values or Color Names, based on data categories. Adapted from a Vega-Lite example and customized for use wit...
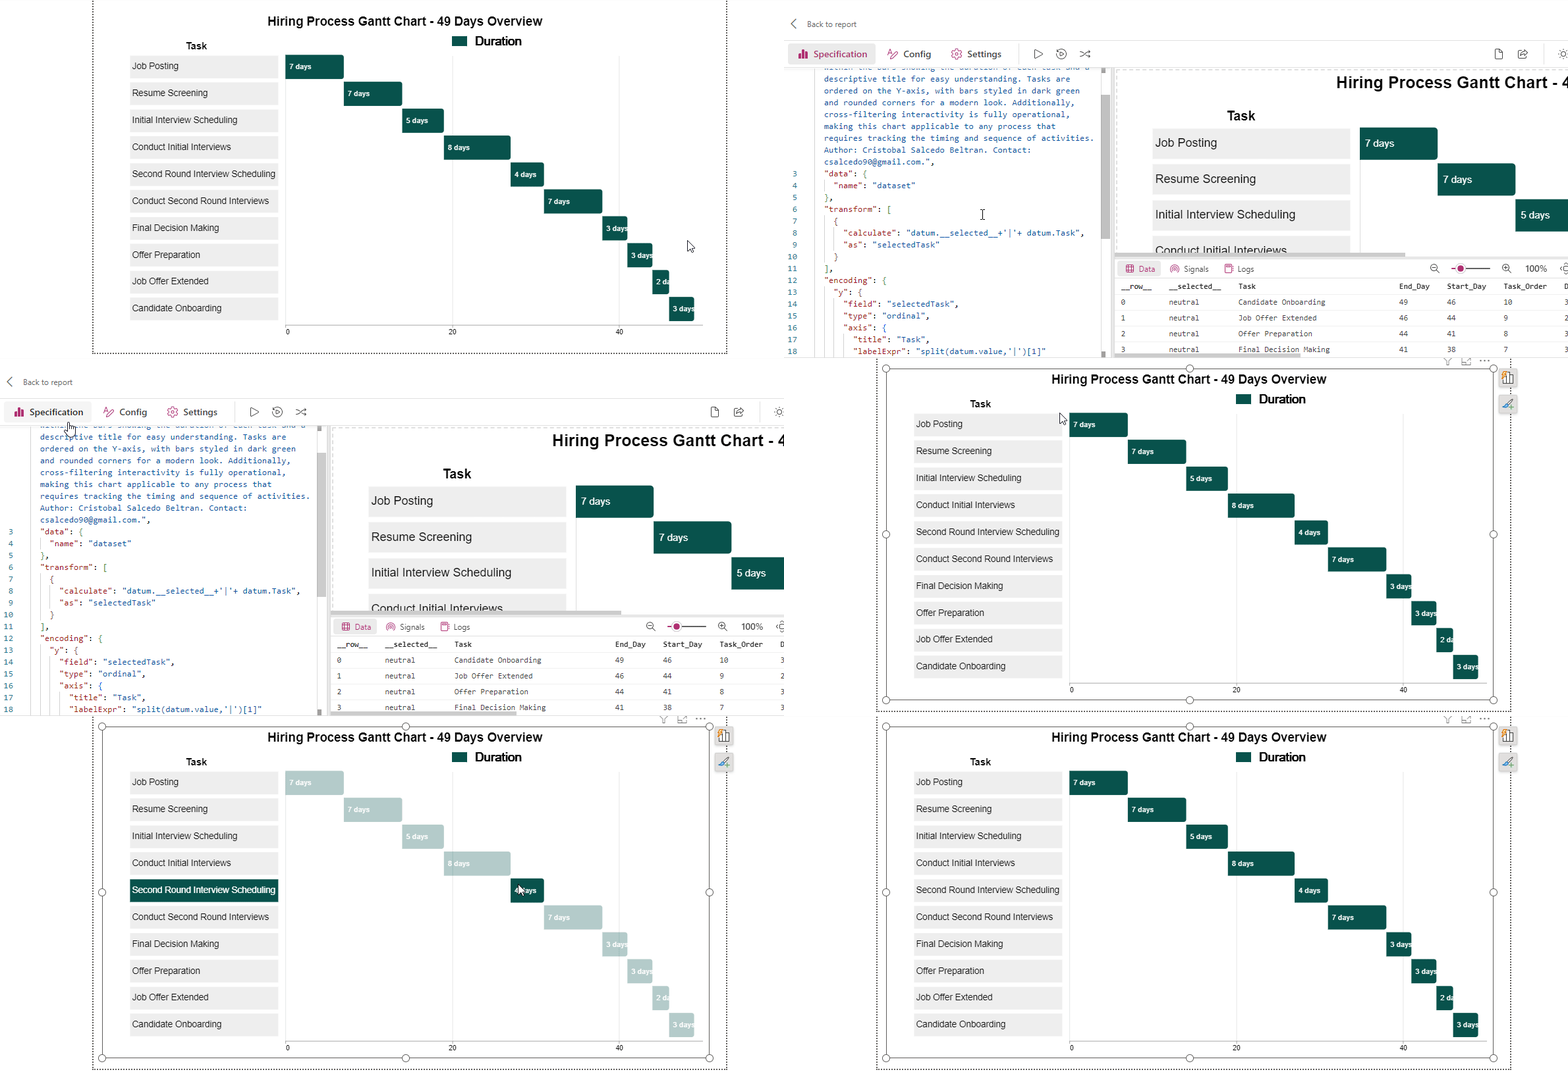
This Gantt chart template, adapted from Vega-Lite and customized for Deneb in Power BI, provides a clear and functional visualization. It includes labels within the bars showing the duration of eac...
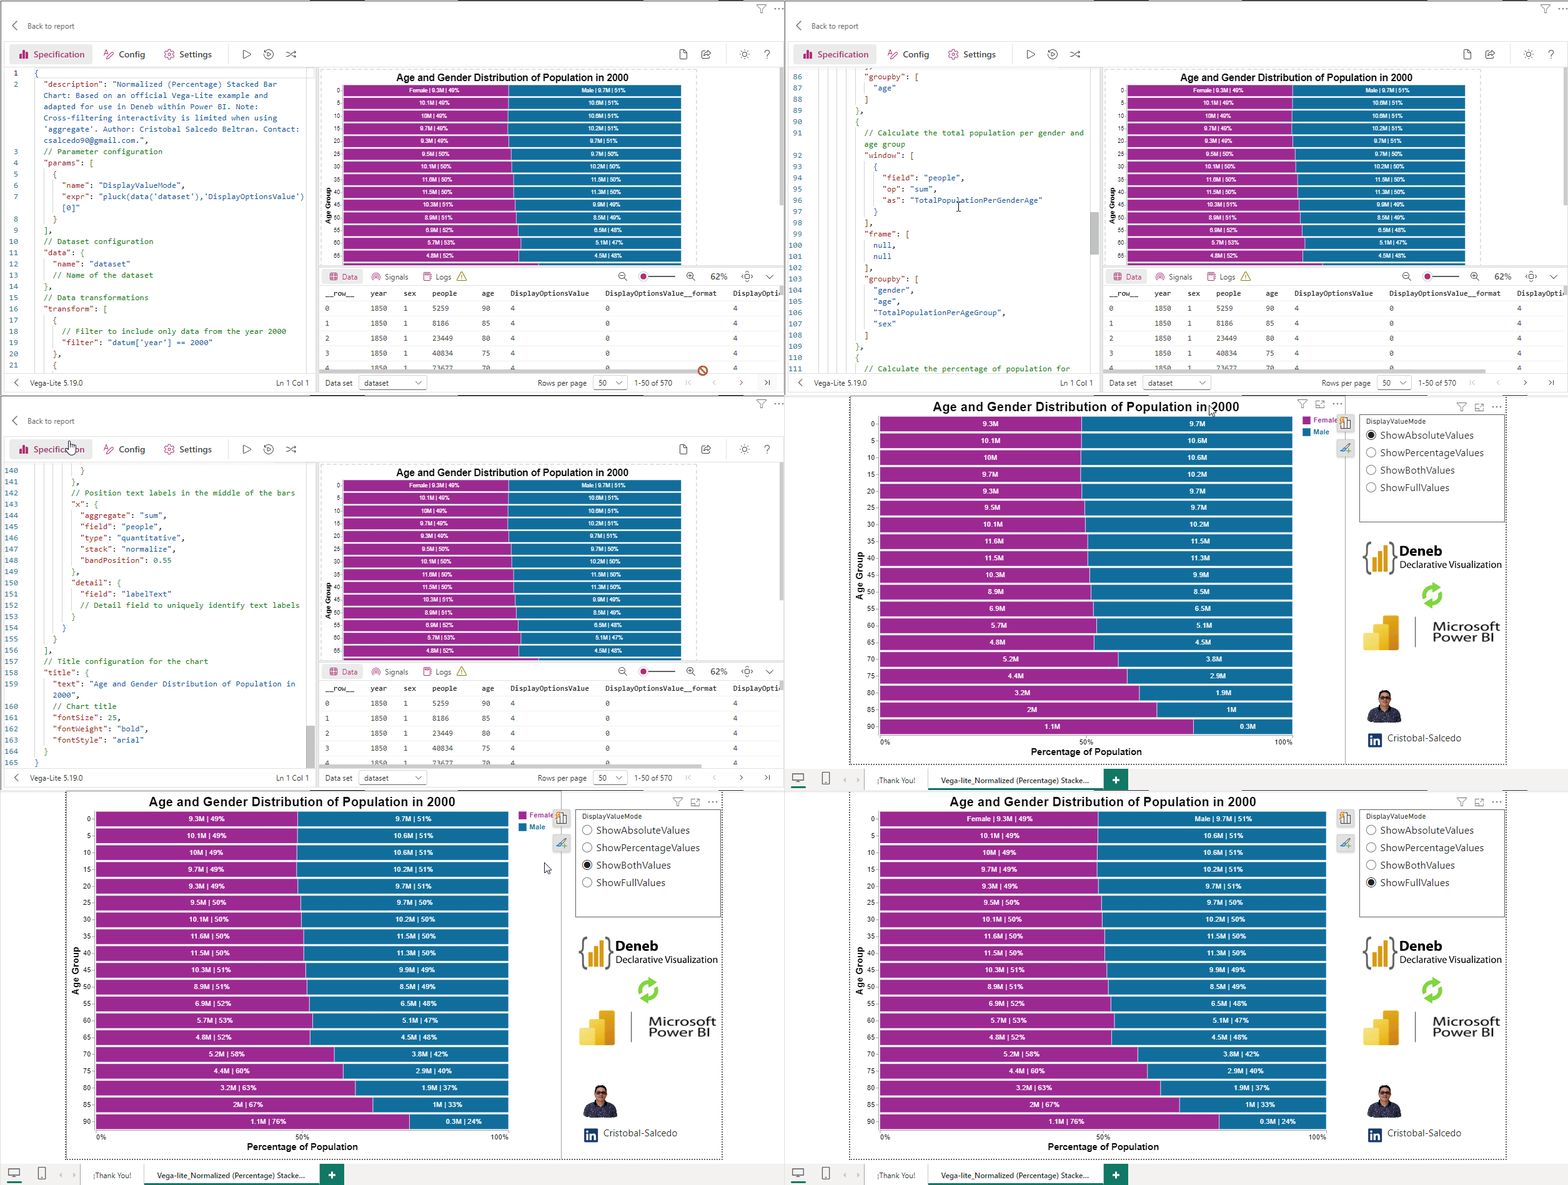
This template for a Normalized (Percentage) Stacked Bar Chart With Dynamic Labels is adapted from the official Vega-Lite example and customized for Deneb in Power BI. Enhancements include the addit...
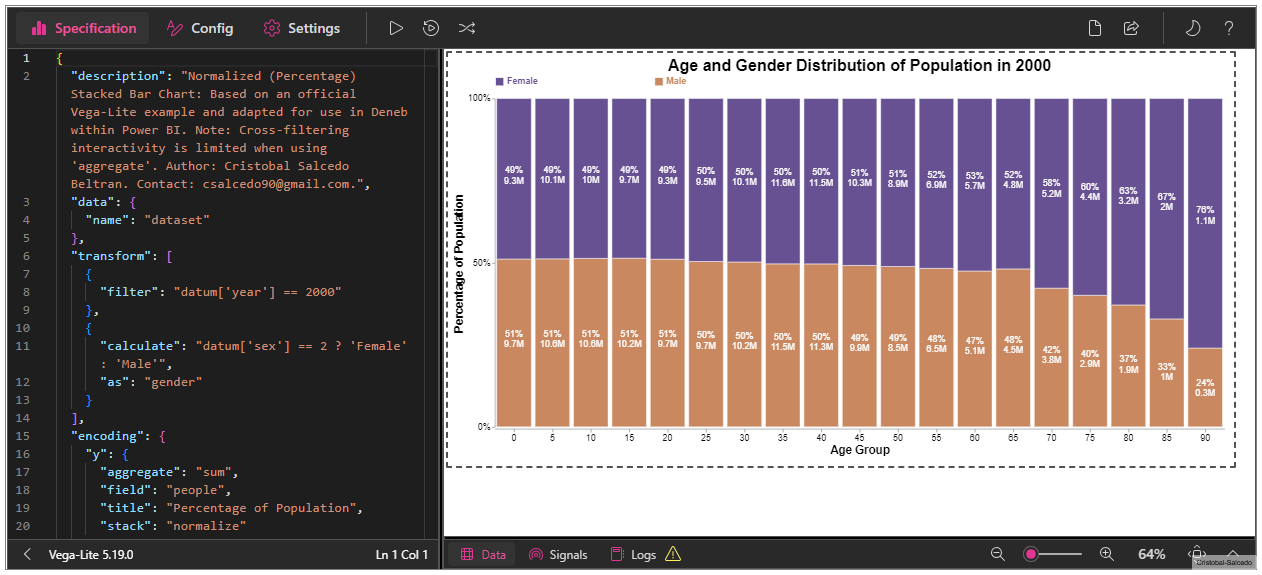
This template for a Normalized (Percentage) Stacked Bar Chart is adapted from the official Vega-Lite example and customized for Deneb in Power BI. Enhancements include the addition of labels and a ...
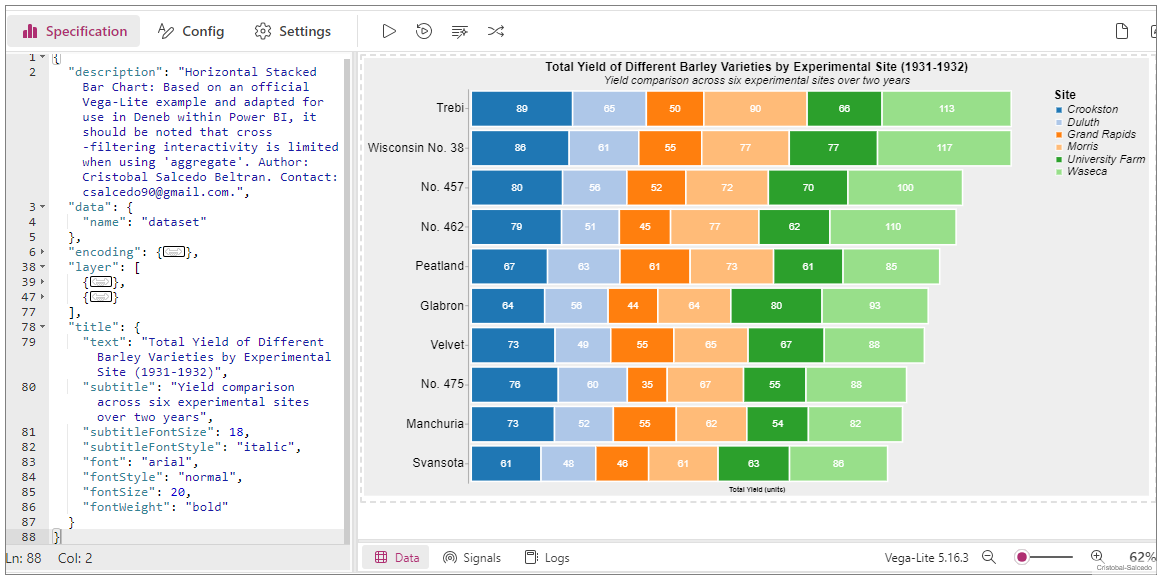
This horizontal stacked bar chart template is adapted from the official Vega-Lite example and customized for Deneb in Power BI. Enhancements include the addition of labels, a descriptive title, and...
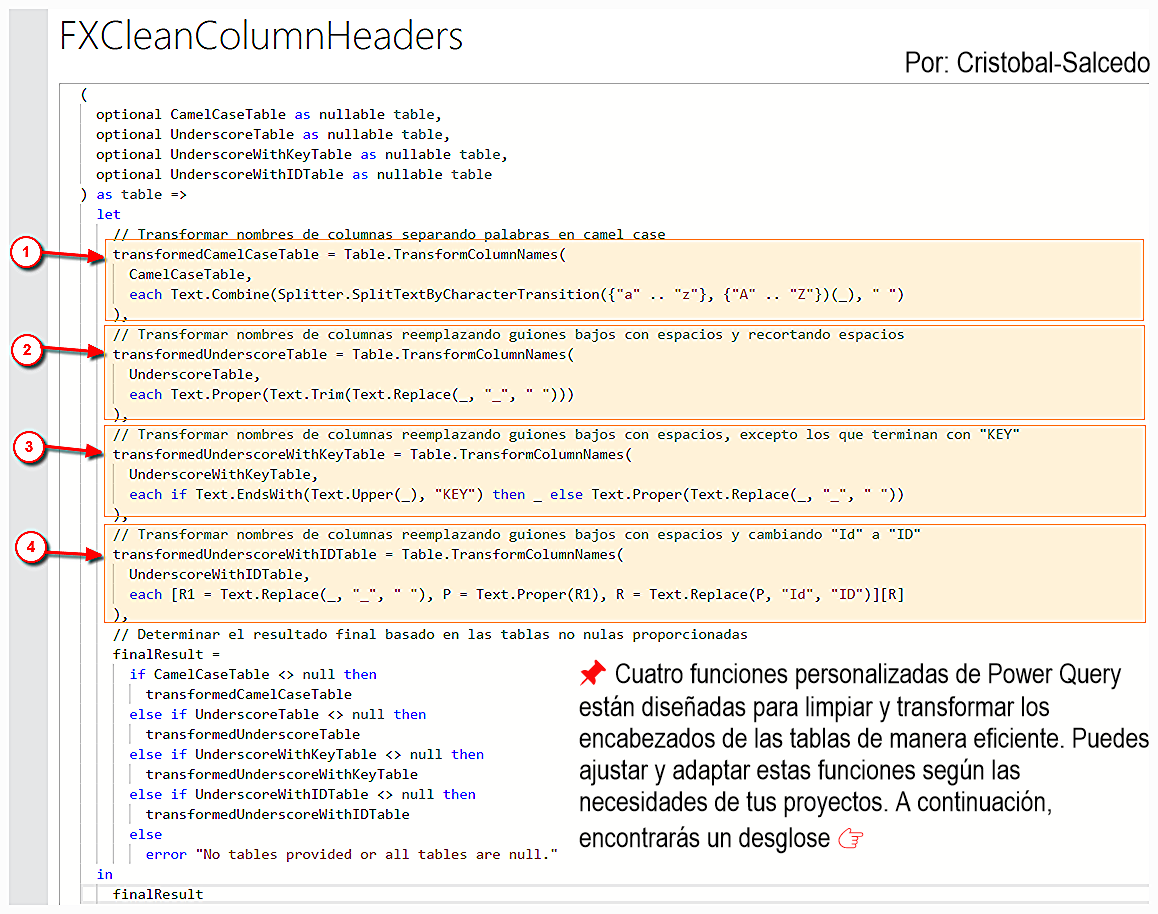
Aprende a crear una función personalizada en Power Query para mejorar la legibilidad de los nombres de las columnas en tus tablas, separando palabras en notación CamelCase y reemplazando guiones ba...
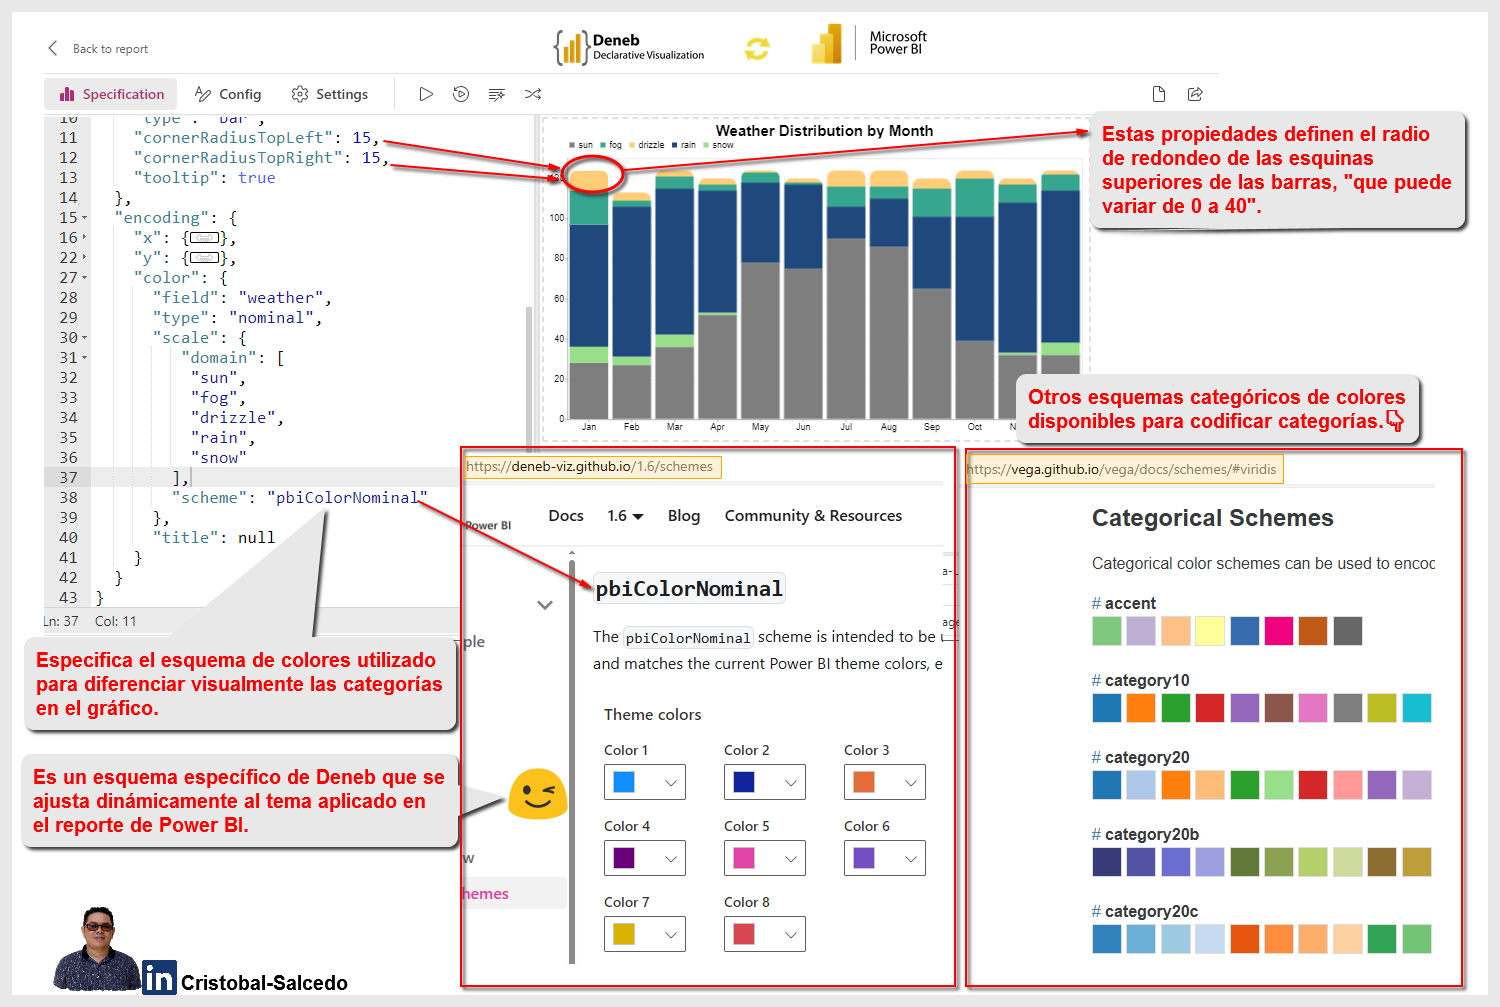
This template for a Stacked Bar Chart with Rounded Corners is adapted from the [official Vega-Lite example](https://vega.github.io/vega-lite/examples/stacked_bar_count_corner_radius_mark.html) and ...